Экономические науки/ 10.Экономика
предприятия
Shynara Jumadilova, Nurlan Sailaubekov
Kazakh National Technical University after K.Satpaev,
Kazakhstan
International Business Academy, Kazakhstan
Capital Structure Management of Oil and Gas Company
Nowadays, one of the main tasks of economic development is occupation of
stable positions of the enterprises in domestic and international markets. Financial and economic sustainability of the enterprise is the company's ability to operate in a changing
internal and external environment, while maintaining a constant solvency and
investment attraction [1]. Therefore,
indicators of capital structure should be considered in evaluating and
analyzing the financial and economic sustainability of the enterprise.
Capital structure ratios: shareholders’ equity ratio; liabilities as percent of shareholders’ equity;
debt ratio; fixed assets as percent of shareholders’ equity; working capital as
percent of current assets; working capital as percent of shareholders’ equity; liquidity
of working capital; working
capital ratio; long-term liabilities as percent of fixed assets; relation of working capital to inventory; relation
of accounts receivable and current liabilities.
Therefore, indicators for capital structure ratios calculation are: ShE – shareholders’ equity; TA – total assets; CL – current liabilities; FA
– fixed assets; WC – working capital; CA – current assets; C&MS – Cash and marketable
securities; LTL – long-term liabilities; I – inventory; AR – accounts
receivable.
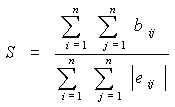
Evaluation of financial and economic sustainability, or the proximity
evaluation of the actual and regulatory indicators relations in terms of their
growth is calculated as follows:
 ,
,
where: S - evaluation of financial and economic sustainability of the
enterprise; n - number of indicators in the regulatory model; i, j – the
sequence numbers of indicators in the regulatory model; bij - the
element of the matrix of matches of the actual and standard ratios growth
rates; eij - the element of the matrix of ratios relations between
the growth indicators.
Sustainability evaluation varies from 0 to 1. The closer the evaluation
sustainability to 1, the more the regulatory relationships between the
indicators are satisfied.
We use a regulatory model for evaluation of the financial leverage. This
regulatory model was made on the basis of capital structure ratios. It is as
follows [2]:
Table 1 – The Regulatory Model for Evaluation of the Financial Leverage
|
Indicators |
ShE |
TA |
CL |
FA |
WC |
CA |
C&MS |
LTL |
I |
AR |
Amount |
|
ShE |
0 |
1 |
1 |
1 |
-1 |
0 |
-1 |
1 |
0 |
0 |
6 |
|
TA |
-1 |
0 |
-1 |
0 |
-1 |
-1 |
-1 |
1 |
0 |
-1 |
7 |
|
CL |
-1 |
1 |
0 |
0 |
-1 |
0 |
-1 |
1 |
0 |
-1 |
6 |
|
FA |
-1 |
0 |
0 |
0 |
-1 |
0 |
-1 |
1 |
0 |
0 |
4 |
|
WC |
1 |
1 |
1 |
1 |
0 |
1 |
-1 |
1 |
1 |
0 |
8 |
|
CA |
0 |
1 |
0 |
0 |
-1 |
0 |
-1 |
1 |
0 |
0 |
4 |
|
C&MS |
1 |
1 |
1 |
1 |
1 |
1 |
0 |
1 |
1 |
0 |
8 |
|
LTL |
-1 |
-1 |
-1 |
-1 |
-1 |
-1 |
-1 |
0 |
0 |
-1 |
8 |
|
I |
0 |
0 |
0 |
0 |
-1 |
0 |
-1 |
0 |
0 |
0 |
2 |
|
AR |
0 |
1 |
1 |
0 |
0 |
0 |
0 |
1 |
0 |
0 |
3 |
|
|
|
|
|
|
|
|
|
|
|
|
56 |
The database in this study is financial statements of JSC
MangistauMunaiGas.
At present JSC
MangistauMunaiGas is one of the largest oil and gas companies of Kazakhstan and
provides more than 8% of production in the country [3].
In Table 2, calculated the actual growth rates based on the consolidated
financial statements of MangistauMunaiGas.
Table
2 - Growth Rates of Financial Leverage Indicators
|
Indicators |
years |
∆2009 /2008 |
∆2010 /2009 |
||
|
2008 |
2009 |
2010 |
|||
|
ShE |
941052 |
1214893 |
1530896 |
1,58 |
1,26 |
|
TA |
2116871 |
1873900 |
2037959 |
1,09 |
1,09 |
|
CL |
973843 |
301753 |
268655 |
0,38 |
0,89 |
|
FA |
1323801 |
1137355 |
1192390 |
1,05 |
1,05 |
|
WC |
-382750 |
77538 |
338506 |
1,25 |
4,36 |
|
CA |
793070 |
736545 |
845568 |
1,14 |
1,15 |
|
C&MS |
81748 |
109759 |
309248 |
1,65 |
2,81 |
|
LTL |
201976 |
357253 |
238408 |
2,17 |
0,67 |
|
I |
161783 |
60857 |
76367 |
0,46 |
1,25 |
|
AR |
285151 |
248559 |
308440 |
1,07 |
1,24 |
On the basis of the consolidated financial statements is created a
matrix of actual growth rates of financial leverage indicators (tables 3 and 4).
Table
3 - Matrix of Actual Growth Rates for the Base Period
|
Indicators |
ShE |
TA |
CL |
FA |
WC |
CA |
C&MS |
LTL |
I |
AR |
|
ShE |
0 |
1 |
1 |
1 |
1 |
0 |
-1 |
-1 |
0 |
0 |
|
TA |
-1 |
0 |
1 |
0 |
-1 |
-1 |
-1 |
-1 |
0 |
1 |
|
CL |
-1 |
-1 |
0 |
0 |
-1 |
0 |
-1 |
-1 |
0 |
-1 |
|
FA |
-1 |
0 |
0 |
0 |
-1 |
0 |
-1 |
-1 |
0 |
0 |
|
WC |
-1 |
1 |
1 |
1 |
0 |
1 |
-1 |
-1 |
1 |
0 |
|
CA |
0 |
1 |
0 |
0 |
-1 |
0 |
-1 |
-1 |
0 |
0 |
|
C&MS |
1 |
1 |
1 |
1 |
1 |
1 |
0 |
-1 |
1 |
0 |
|
LTL |
1 |
1 |
1 |
1 |
1 |
1 |
1 |
0 |
0 |
1 |
|
I |
0 |
0 |
0 |
0 |
-1 |
0 |
-1 |
0 |
0 |
0 |
|
AR |
0 |
-1 |
1 |
0 |
0 |
0 |
0 |
-1 |
0 |
0 |
Table
4 - Matrix of Actual Growth Rates for the Reporting Period
|
Indicators |
ShE |
TA |
CL |
FA |
WC |
CA |
C&MS |
LTL |
I |
AR |
|
ShE |
0 |
1 |
1 |
1 |
-1 |
0 |
-1 |
1 |
0 |
0 |
|
TA |
-1 |
0 |
1 |
0 |
-1 |
-1 |
-1 |
1 |
0 |
-1 |
|
CL |
-1 |
-1 |
0 |
0 |
-1 |
0 |
-1 |
1 |
0 |
-1 |
|
FA |
-1 |
0 |
0 |
0 |
-1 |
0 |
-1 |
1 |
0 |
0 |
|
WC |
1 |
1 |
1 |
1 |
0 |
1 |
1 |
1 |
1 |
0 |
|
CA |
0 |
1 |
0 |
0 |
-1 |
0 |
-1 |
1 |
0 |
0 |
|
C&MS |
1 |
1 |
1 |
1 |
-1 |
1 |
0 |
1 |
1 |
0 |
|
LTL |
-1 |
-1 |
-1 |
-1 |
-1 |
-1 |
-1 |
0 |
0 |
-1 |
|
I |
0 |
0 |
0 |
0 |
-1 |
0 |
-1 |
0 |
0 |
0 |
|
AR |
0 |
1 |
1 |
0 |
0 |
0 |
0 |
1 |
0 |
0 |
Conformity of the actual relations with the regulatory model for the periods
under consideration is: 34 for the base and 52 for the reporting period. Consequently,
generalized evaluation of financial and economic sustainability on financial
leverage indicators is: ![]() -
for the base period and
-
for the base period and ![]() -
for the reporting period.
-
for the reporting period.
Then we identify factors of sustainability growth. The factors of
sustainability growth are the indicators, which impact on the overall
evaluation of the financial leverage in the reporting periods, as well as to
evaluate the impact degrees of these factors. This requires the factorial
analysis of financial leverage evaluation.
Table
5 – Factor Analysis of Financial and Economic Sustainability on Financial Leverage
Indicators in the Reporting Period
|
Indicators |
№ |
Conformity |
Deviations |
Impact on |
||||
|
2009 |
2010 |
2010 |
Increase of
sustainability |
Value of
sustainability |
||||
|
absolute |
% |
absolute |
% |
|||||
|
1 |
2 |
3 |
4 |
5 |
6 |
7 |
9 |
10 |
|
ShE |
1 |
4 |
6 |
0 |
0,0357 |
5,88 |
0 |
0 |
|
TA |
2 |
4 |
6 |
1 |
0,0357 |
5,88 |
0,0179 |
4,55 |
|
CL |
3 |
4 |
5 |
1 |
0,0179 |
2,94 |
0,0179 |
4,55 |
|
FA |
4 |
3 |
4 |
0 |
0,0179 |
2,94 |
0 |
0 |
|
WC |
5 |
6 |
7 |
1 |
0,0179 |
2,94 |
0,0179 |
4,55 |
|
CA |
6 |
3 |
4 |
0 |
0,0179 |
2,94 |
0 |
0 |
|
C&MS |
7 |
7 |
7 |
1 |
0 |
0 |
0,0179 |
4,55 |
|
LTL |
8 |
0 |
8 |
0 |
0,1429 |
23,53 |
0 |
0 |
|
I |
9 |
2 |
2 |
0 |
0 |
0 |
0 |
0 |
|
AR |
10 |
1 |
3 |
0 |
0,0357 |
5,88 |
0 |
0 |
|
Total |
34 |
52 |
4 |
0.32 |
52.94 |
0.07 |
18.18 |
|
Conclusion
Most
indicators’ dynamics improved during reporting period. At the same time
indicators TA, CL, WC and C&MS declined. Their common impact on increase of
sustainability made up 0.32 or 53%. Total evaluation of financial and economic
sustainability on financial leverage indicators in 2010 is 0.93.
In
order to satisfy regulatory matrix is necessary to:
1.
Increase CL to 22%;
2.
Increase C&MS for 56% or reduce WC on 36%.
References:
1.
Sh. Jumadilova. The economic content of the financial sustainability of the
enterprise under modern conditions / / Bulletin of KazNU. econ. ser. - №1 (83).
- 2011. - pp. 46-50
2.
N. Sailaubekov. Methods of analysis of complex economic and financial
activities of the enterprise based on dynamic standard / /Bulletin of the Turan
University. -№ 3 (39)- 2008. - pp. 64-66
3.
Official site of JSC MangistauMunaiGas / / http://www.mmg.kz/