Economic Sciences/8. Math methods in economics
Taras Fedoruk, Postgraduate student
Simon Kuznets Kharkiv
National University of Economics, Kharkiv, Ukraine
Multivariate Statistical Analysis in Defining Ukraine's Possible Place after Joining the EU
It is accepted that Ukraine's long term goal is to
become a part of the European political system, so it is needed to analyze the possible place of Ukraine within the European
Union. If we
consider this issue in the context of a number of economic
indicators we should clearly understand what factors are critical to the
economic system of the European Union. Bearing in mind
the difficult and intricate relationships between
economic indicators, it is required, for further analysis needs, to classify
the European Union members in terms of their economic
level. So, cluster analysis methods are considered as the
most appropriate ones. They allow to divide the objects into
groups with common characteristics in a multivariate space. With a goal to
determine the place of Ukraine among the European countries we should take a
look at the classification methods of the previous
study, i.e. those that can match the new object to the class already known [1, 2]. Defining the place of Ukraine among the countries of the European Union it would be possible
to make some reasonable assumptions about the possibilities for economic improvement under the trends inherited from the particular class. To do this, it is necessary to use the
discriminant analysis methods because they are easy to use, and the results obtained can be easily interpreted and used in the subsequent research [3].
The initial data for the analysis are the UNECE statistics for the countries of the European Union and
Ukraine in 2011 and 2012 in the following categories of
indicators [4]:
social indicators - the employment growth rate,%;
unemployment rate,%;
monetary indicators - the consumer price index,
calculated in
comparison with 2005, %;
the consumer price index growth rate,%; purchasing
power parity; the exchange rate against the US
dollar, c.u.; the GDP deflator growth rate,%;
commodity weight indicators - GDP per capita in international comparable prices, USD/person; growth rate for GDP per capita, %.
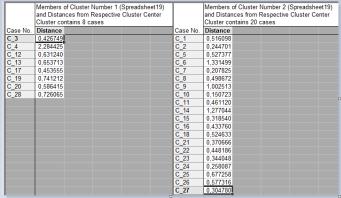
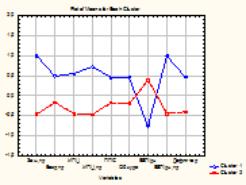
Fig. 1 The
cluster analysis results for 2011
Applying the k-means method, we have got two classes of countries within the EU. We can see that it is possible to find the following clusters of
countries in 2011 as part of EU:
Bulgaria, Hungary, Latvia, Lithuania, Poland,
Romania, Slovakia, Estonia — the countries of the former Soviet
Union or those that were under the influence of the
Soviet Union, and which joined the EU in 2004 and 2007, before the
economic crisis.
Austria, Belgium, Germany, Greece, Denmark,
Ireland, Spain, Italy, Cyprus, Malta, Luxembourg, Netherlands, Portugal,
Slovenia, the UK, Finland, France, Croatia, Czech Republic, Sweden - a group of
countries that a) make up the backbone of the EU since its foundation (like
France); b) the relative
"newcomers" such as Malta and Croatia, which have recently
joined the EU; c) other developed countries of Western Europe.
The analysis of the average values of variables in each cluster shows the
following. The first cluster countries are characterized by significant
employment growth rate, CPI and GDP per capita, at the same time, there is a high level of unemployment,
inflation and a sufficiently low amount of GDP per capita. It can be concluded that the EU
membership has given a great impetus to the development of their economies
through the open trade routes and the relations simplicity
within the Union. The relatively low GDP per capita can be explained by the
fact that today these countries have had not enough time to modernize in order
to catch up with other countries on this
indicator. Countries of the second cluster are described by a high level of GDP
per capita and a relatively low inflation and unemployment level.
At the same time, low growth rates of employment and unemployment, which are close to the appropriate levels in the first
cluster, serve as
an undeniable evidence of the fact that the second cluster countries have used internal resources for the previous point
maintenance. This may also be due to the presence of Greece and
Spain within this cluster, in support of which huge amount of resources and
efforts have been provided by the EU.
In order to review the situation dynamically, we have made an attempt to use the cluster analysis method for 2012 data to find out some trends.
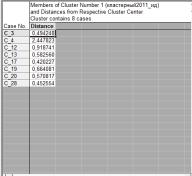
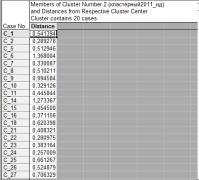
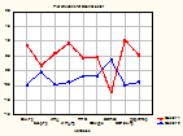
Fig. 2 The
cluster analysis results for 2012
We can see that the countries lists have not been changed. However, some tendencies are taking place. For example, Greece is trying to
change the cluster, because the distance to the cluster center becomes longer.
The example for the first cluster is Hungary. Generally it means that
these two countries might change the clusters and that
will affect their economic policies as well.
To sum up, the cluster analysis results prove the
positive influence of the existing members' economic level for the new members-countries. It means
that the new countries get a chance to reach a new living standard oriented to the highly developed EU members.
We can define the place of Ukraine in the current EU configuration using the linear discriminant analysis.
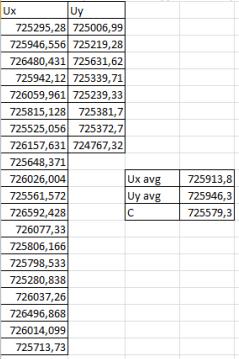
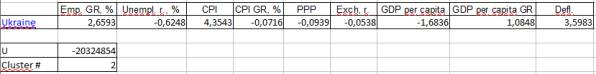
Fig. 3 The
discriminant analysis results
According to this method, Ukraine has become the first cluster country. Taking into account the
current situation, the result is quite logical. Ukraine is
a country of the former Soviet Union and claims to become a
member of the European Union. Due to its claims, the
Ukrainian Government
is gradually striving to improve
the economic performance, so that the participation in the European
Union will not be a burden for the country. However, according to the results of the cluster analysis, the economy of the European Union is quite a living system, so Ukraine's accession to the EU
will lead not only to the Ukrainian economy development, but also to a slight decline in the European economy. As a
result, the European Union authorities will be careful and ensure that a repeat of the Greek
scenario is prevented. The last but not the least is the attention to the high growth
rate of inflation and low GDP per capita as the characteristics of the second
cluster. Given the fact that Ukraine belongs to this class, we should analyze the prospects of Ukraine's accession to the European Union.
This will help to make weighted management
decisions, determine the direction of the future development, identify the bottlenecks in the current economic
development and successfully counter the potential threats.
References
1. S. Dronov
Multivariate statistical analysis. - M.: Berator, 2003. - 591 p.
2. B. Duran
Cluster analysis. - M.: Book on Request, 2012. - 469 p.
3. J. Kim
Factor, discriminant and cluster analysis. - M.: Book on Request, 2012. - 216
p.
4. Statistical Database - United Nations Economic Comission for Europe [Internet resource]. Access mode: http://w3.unece.org/pxweb/?lang=14