Studying External
Load in Water Reservoirs on the Example of Slawskie Lake
|
|
|
|
Adam Malecki, DEng e-mail: a.malecki@iis.uz.zgora pl |
Jacek Bojarski, D e-mail: j.bojarski@wmie.uz.zgora.pl |
|
Uniwersytet Zielonogórski, Zakład Teorii
Prawdopodobieństwa i Procesów Stochastycznych |
|
Abstract: The structure of
the catchment basin of Lake Slawskie, in particular the amount of nutrients, as
released therefrom and, consequently, the quality of the lake’s Walters, is
adversely influence by inappropriate agricultural practice and municipal
economy, especially concerning sewage treatment. The basic source of nitrogen
is agricultural area contamination, whereas the source of phosphorus are point
pollutant discharges from unsewered areas. Water examination included measuring
physical parameters (pH, temperature), oxygen conditions (oxidization,
dissolved oxygen), content of organic substances (BZT5, ChZTCr),
as well as concentration of biogens (nitrogen and phosphorus compounds), as well
as sulphate and chloride ions. The results, as obtained, pertaining to the
quality of the waters, were subjected to appropriate, adequate statistical
analysis. The article presents the results of total nitrogen and overall
phosphorus. Variability of the studied elements within the tributary water, and
existence of a linear trend, if any, or lack thereof concerning variation of
the factor in question, has been studied by means of regression analysis. For
the purpose of trend analysis within five-year measurement series and change
forecasting, an advanced statistical tool has been used, as applied for time
series analysis. It is SARIMAX, a modification of the non-stationary SARIMA model,
taking into account descriptive variable lag within the autoregressive model.
Introduction
Protection of lakes and water reservoirs is, in
fact, a matter of limitation of external loads of biogenous substances drained
from the catchment basin. Implementation of difficult and costly protective
measures must always be preceded by calculation of external loads, especially
phosphorus and nitrogen. It allows, on the one hand, to estimate the hazards
for the lake and define a necessary degree of biogen reduction, and on the
other – it enables designing appropriate protective methods.
Calculation of loads of biogenous compounds, as
loading a given lake, may be effected by means of:
- direct
examination
- estimation
Direct examination implies execution of a great
number of hydrological measurements and physicochemical analyses of waters of
all surface affluents and sewage drained into the lake. Being work-consuming
and long-lasting, such research is most frequently replaced by application of
estimation methods, by means of which to determine external load in water
reservoirs. These imply estimation of the amount of nitrogen and phosphorus of
sewage origin (point and diffuse sources), farming-related (area sources),
draining from roads, as used within the basin (linear sources) and biogens
introduced onto the lake surface from the atmosphere (atmospheric sources). This
requires adequate recognition of the basing management methods and the number
of inhabitants populating the catchment in question which is largely
problematic with vast basins. Moreover, it is obvious that biogens which are
drained in the vicinity of the basin edges are oftentimes much more likely to
reach the lake than of the ones led out many kilometres away. Estimating
methods often do not take it into account at all. Bearing the above in mind,
external load in Lake Slawskie has hereby been presented, as calculated with
the direct measurement method and estimation.
Object
of the Study
The object of the study comprises the catchment
basin of Lake Slawskie (817.3 ha, max. Depth 12.1 m, mean depth 5.3 m, capacity
43 x 106 m3), located in the south-eastern outskirts of
the Lubuski Region. The lake has the basin (Graph 1) of the area of 206 km2
(Fig. 1). Out of the lake’s six surface affluents, the decisively dominating
one is Czernica, introducing its waters into the eastern
part of the lake and draining an area of 60.5
km2. The river’s catchment area, like the other ones’, is of
agricultural and forest character; there are four populated localities within
the area with 275 farms. The Czernica catchment is inhabited and managed by 1,840
people. The population of the basin areas is 57 people per 1 km2.
Methodology
of the Study
The direct examination was conducted between
November 1999 and December 2003. Within the period, measurement of flow density
was taken, at monthly intervals, at estuaries of the six surface affluents, alongside with physicochemical examination of the waters.
Calculations allowed for the direct catchment of Lake Slawskie.
For the purpose
of estimation, average land management of the Commune of Slawa was assumed (Table 1, 2), as well as unit drain coefficient values, according to Giercuszkiewicz-Bajtlik
(1990). Simultaneously, a limnological study
of the waters of Lake Slawskie was being done. In order to estimate the
critical phosphorus and nitrogen load of the lake, the Vollenweider model was
applied (1968, 1976), accounting for hydraulic load and water retention time in
the reservoir.
Results and Discussion
The results of the five-year study of the waters of
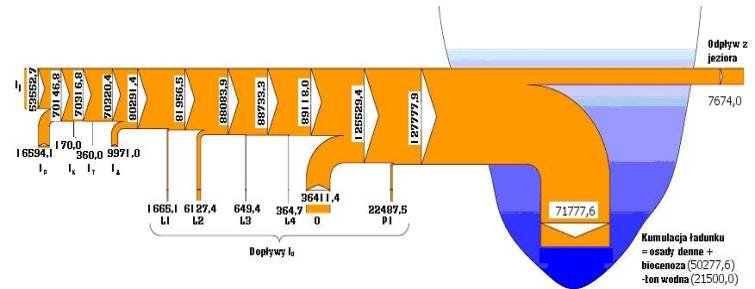
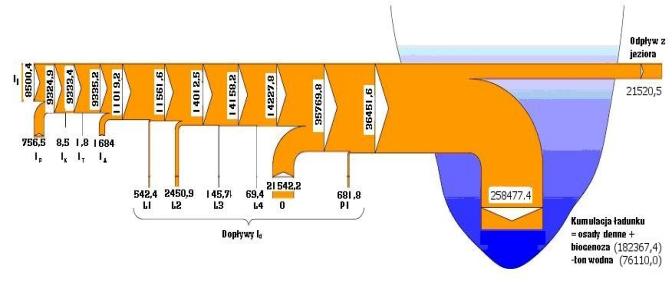
Lake Slawskie demonstrate a progressing process of its eutrofisation (Table 3). The list of biogen sources reaching
Lake Slawskie shows that accumulation of phosphorus in the lake was, within the
period included in the study, 50,278 kg/year (average value), whereas the
average nitrogen load amounted to ca. 182,367 kg. This is, among others,
evidenced by the rising concentration of total phosphorus and nitrogen (Fig. 2
and 3).
The lake’s
degradation vulnerability, as calculated by Kudelska et al. (1994) (Table 4) demonstrate
average dependence on external influences. The data included in Table 4 shows
that Lake Slawskie is to be classified as Category IV with respect to
susceptibility to degradation, i.e. being highly exposed to catchment
influence, thus creating a landscape system which is characterised by a
progressing process of water eutrophication. Vollenweider’s equation (1976) allows to estimate to
what extent the present state of the lake concords with its load and to what
degree this should be limited in order to achieve a satisfactory condition
thereof.
Table 5
compares the permissible and hazardous values of phosphorus and nitrogen in the
waters of Lake Slawskie according to Vollenweider’s criterion (1976). As one
may see in the table, the actual phosphorus load in Lake Slawskie, as measured
year-by-year within the study, exceeds the hazardous level a few times, whereas
the nitrogen load exceeds, except for the year 2001, the permissible values,
comprising – on average – 58% of the hazardous load. This is an extremely
important problem with respect to the strategy of lake water quality
management. The quantity of phosphorus load to be eliminated from the lake
inflow comprises a difference between the external load of the lake and the
permissible level. This estimation constitutes also a foundation for all
reclamation measures based on elimination or inactivation of phosphorus. Lakes of
more favourable natural characteristics (Category I) stand a better chance for
restoration than ones which are vulnerable to external influences (Category III).
Janczak (2002) studied degradation susceptibility of Lake Slawskie in the years
1991-1997. The results are similar: 1991 – 1.5 points/Category II; 1992 – 2.2
points/Category II; 1993 – 2.2 points/Category II;1994 – 2.8 points/Category
III; 1995 – 2.9 points/Category III; 1996 – 3.1 points/Category III; 1997 – 3.1
points/Category III.
One should state that the lake is at very high
risk of biogen delivery from external sources, as compared to its natural
resistance. The estimation for the years 1999-2003 enables to forecast that
improvement of the lake’s water quality is possible. It is practicable to apply
a number of protective measures, however the first step to be taken is to
arrange for the water and sewage management in the catchment area.
The value of
balanced concentration in Lake Slawskie, corresponding to its load in the years
1999-2003, was 0.052 mg P/m2/year, whereas the measured value
amounted to 0.,50 mg P/m2/year. This shows that the condition of the
lake is far from equilibrium, taken the existing external load, which, as per Vollenweider’s
equation, calls for reduction of its mean concentration. This would require,
apart from providing for full drainage of the direct catchment basin, that the
amount of drained post-sewage water be largely reduced, with buildings located
within sparsely-populated areas being equipped with individual treatment
facilities. In addition, it is necessary to lower agriculture-related load
contributions, as well as abide by the principles of good practice in farming. Implementation
of the abovementioned activities could reduce the lake’s biogen load by 31,731
kg P and 80,917 kg N, in
aggregate, provided that inflowing waters were of the first class
of purity, which – for the time being – would not call for any technical
interference within the lake’s sheet of water. Contribution of individual
sources before and after application of accessible measures is illustrated in
Table 6.
Conclusions
The basic
problem of the catchment basin of Lake Slawskie is insufficient equipment of
the infrastructure with facilities for collection, drainage and treatment of
sewage. The waters of Lake Slawskie are characterised by a very high level of trophy.
This is a result of the progressing eutrophication, i.e. constant high load
with polluted affluent waters.
The article
defines main sources of hazards for purity of Lake Slawskie’ waters, alongside
with necessary data comprising a basis for development of guidelines concerning
protection of the waters of the basin and the lake against further degradation
within the municipal, industrial and agricultural sectors which, if
implemented, will contribute to reduction of biogenous substance discharges.
Total nitrogen in the tributaries
shows slight variation, with essential seasonality of up to three years, which
may indicate both increased intensity of inflowing contaminants and spontaneous
production of this impurity. As far as outflows are concerned, total nitrogen
is characterised by lack of autoregression and significant linear correlation
with the content of total nitrogen in the lake 11 and 12 months earlier, as
well as a lower level than the one detected in the lake. This would suggest
that the lake acts like a battery, which is also evidenced by negative
coefficient values at Ac11 and Ac12.
In
case of phosphates, the situation is analogous. Levels of this contaminant is
similar in both out- and inflowing waters, whereas the lake water level is
significantly lower.
In case of total phosphorus, the
lake acts like a battery: 1999,2000,
and in the years 2001,2002 – it is also a biogen generator. In general, one may
observe frequent exeedance of the mean values of the examined pollutants in the
lake, as compared to the content of these components in outflowing waters,
wherein the tendency is rising.
In the light
of the conducted research, the results, as acquired, allow for the following
conclusions:
1. Average
retention loss is 221 mm per year. Lake Slawskie has its whole area situated
within an aquifer. The water-bearing layer is a balance-loss compensator.
Having assumed that the waters of Lake Slawskie are replenished with underground
waters in the amount of ca. 10% - the result is restoration of water balance.
2. The results
indicate clearly that origin of nitrogen and phosphorus loads, as drained into
the surface water from individual partial catchments (with the Czernica basin
being the major source of biogens flowing into Lake Slawskie), is spatially
diverse. Within the period under study, this made average loads of 0.89 mg P/dm3
and 3,.29 mg N/dm3, respectively. The content of biogens flowing in
with the Czernica waters comprises 76.8% of nitrogen and 84.7 % of phosphorus,
as drained into the lake. The river delivers a mean yearly amount of ca. 21.5 tonnes
of phosphorus and 36.4 tonnes of nitrogen. The Jeziorna river catchment loads
Lake Slawskie the least, bringing in 0.19 mg P/dm3 and 1.1 mg N/dm3.
This supports the assumption that afforested areas protect surface water
against biogen drain to a larger degree. Farmed land dispose of a surplus of
biogens (ca. 106.5 kg N/ha/year and ca. 18.2 kg P/ha/year), which, with intense
rain- and snowfall, infiltrates into underground and surface waters.
3. The obtained results comprise evidence of gradual degradation of Lake
Slawskie caused by excessive inflow of biogens from partial catchments, which
also indicates a trend for the coming five and ten years in case hitherto method
of management of the catchment should prevail.
4. The water of Lake Slawskie is, with respect to its physicochemical properties,
classified as “impaired” (undergrade). Improvement of the quality of the lake’s
waters may only be achieved by increasing purity of all watercourses which feed
it, as these deliver a majority of pollutants. Hence, one may argue that elimination
of sources of contaminants may improve the existing quality of the waters, as
well as maintain a higher standard thereof in the future.
5. Adequate water and sewage management by the Town of Slawa, as well as
the numerous holiday resorts and homes, is a determinant for the future of the
lake’s waters. Moreover, it is necessary to promptly develop a Lake Slawskie
protection program, including a detailed analysis of the reasons of
degradation, alongside with a set of propositions as to what counteracting measures
should be undertaken. The first stage, however, should focus on protective
activities.
6. The incoming phosphorus load is, according to Vollenweider’s
criterion, higher (0.50g P/m2) than the permissible level (0.052 g
P/m2), exceeding the hazardous one as well (0.104 g P/m2).
The low N to P ratio testifies to the presence of municipal sewage in the
lake’s waters, which explains rapid growth of algae and cyanobacteria n summer.
Internal supply, as defined by a ratio of total phosphorus in the surface layer
within summer, at the peak of stagnation, to its concentration in spring, at
the beginning of the circulation period, is 1.15, showing that biogenous
substances are released from bottom residues during summer, which may be
distributed within the whole of the lake’s capacity and used in the photic
layer by plant complexes in the same way as compounds which are drained into
the lake from its catchments. This estimation comprises basis for all
reclamation measures based on elimination or inactivation of phosphorus.
7. Analysing the impact of area pollution upon the quality of surface
waters, one should examine every catchment, starting at its source area, in
order to determine, based on differences concerning the chemical composition of
water between the profiles of the watercourse under study, the degree of change
triggered by the influence of contaminants. Only having significantly reduced
biogen inflow from the catchment, one can consider practicability of
application, in selected reservoirs, of a coagulant precipitating excessive
contents of phosphorus, and resulting in inactivation of the element within
residues.
In the
author’s opinion, in order to achieve the abovementioned goals it is necessary
to implement the following activities:
- the lake is a functional part of the catchment landscape system, hence
preservation of quality of its ecosystems and purity of waters is only possibly
through protection of the whole hydrological system, including the land area,
- arranging for the water and sewage management in such a way that the inflowing
rivers should be of the first class of purity,
- collection and treatment of all sewage from the neighbouring
localities and B&Bs within the direct catchment will protect the lake
against pollution as well as result in averting the degradation processes,
- implementation of principles of integrated farming may significantly
contribute to reduction of the process of biogen release from the catchment
area into the surface waters,
- water usage should be confined within small areas, so that large
amounts of contaminants are not carried out of the place where these are
produced,
- boggy complexes and the lake litoral vegetation is a productive
contributor to reducing the lake’s eutrophication load; such habitats should be
preserved or even restored,
- large load of the lake’s waters with biogens undermines technical
reclamation, unless the amount of contaminants drained from the catchment is
significantly reduced – then supporting activities within the lake’s sheet of
water will be possible,
- it is suggested that research work be continued concerning the
broadest possible scope of protection of the waters of Lake Slawskie, this work
comprising a practicable foundation for such undertakings.
The research,
as conducted, shows straightforwardly that there is a need to improve the
natural qualities of the Lake Slawskie catchment basin and adopt forms of
development and management of the area to the economic, cultural and aesthetic
virtues of this place. One should pay particular attention to remedying the
effects of contaminants and degradation, as well as the origin thereof. While
protecting the environment, just like in case of health protection, we call for
preventive measures, especially counteracting harmful practices, to be the most
effective way of dealing with the problem.
Bibliography
Giercuszkiewicz-Bajtlik M., 1990: Prognozowanie zmian jakosci wod stojacych. Instytut Ochrony Srodowiska, Warszawa [Warsaw], pp.1-69.
Kudelska D., Cydzik
D., Soszka H., 1994: Wytyczne monitoringu
podstawowego jezior. Biblioteka
Monitoringu Srodowiska. Warszawa.
Malecki A., 2008: Oddzialywanie zlewni czastkowych
Jeziora Slawskiego na bilans wody i biogenow. Uniwersytet Zielonogorski [University of
Zielona Gora].
Vollenweider R. A., 1968: “Scientific fundamentals of the eutrophication
of lakes and flowing waters, with particular reference to phosphorus and
nitrogen as factors in eutrophication”.
OECD
Technical Report DAS/CSI/68.27, pp.159, Paris.
Vollenweider R. A., 1976: Advances in defining
loading levels for phosphorus in lake eutrophi-cation. Mem. Ist. Ital. Idrobiol., No 33,
pp.53-63.
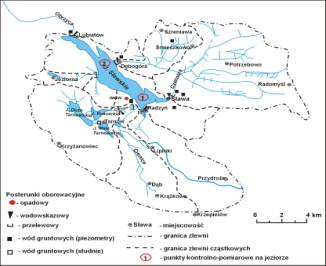
Observation posts Slawa - localities
rainfall- catchment boundaries
watermark- partial catchment boundaries
overflow 1- control-measurement points on the lake
ground waters (piezometers)
ground waters (wells)
Fig. 1. Control-measurement and observation posts within the Lake
Slawskie catchment
Table 1. Land application structure within the Lake Slawskie catchment,
as set against the Commune of Slawa [acc. to the
commune’s own data]
|
Item |
Application |
Area |
||||
|
Commune of Slawa |
Catchment |
|||||
|
ha |
% |
ha |
% communal |
% catchment |
||
|
1. |
Total area |
32,678 |
100 |
20,600 |
63.0 |
100 |
|
2. |
Farmland |
13,487 |
41.3 |
8,181 |
68.7 |
39.7 |
|
- arable
land |
10,987 |
33.6 |
5,806 |
52.8 |
28.2 |
|
|
- grassland |
2,500 |
7.7 |
1,374 |
54.9 |
6.7 |
|
|
3. |
Forests |
15,927 |
48.7 |
10,170 |
63.8 |
49.3 |
|
4, |
Urbanised
area |
432 |
1.3 |
255 |
61.3 |
1.3 |
|
5. |
Waters |
1,031 |
3.2 |
1,003 |
97.3 |
4.9 |
|
6. |
Others |
1,801 |
5.5 |
991 |
55.0 |
4.8 |
|
7. |
Protected
landscape area |
11,100 |
34 |
11,100 |
100 |
53.9 |
Table 2. Management of the Lake Slawskie partial catchments
|
Catchment name |
Area Tereny |
Lakes |
Other |
|||||||||
|
Acc. to IRS* |
Author’s own measurement |
Forests |
Buildings |
Farmland |
||||||||
|
[km2] |
[km2] |
% |
[km2] |
% |
[km2] |
% |
[km2] |
% |
[km2] |
% |
||
|
Direct catchment |
41.10 |
36.17 |
15.65 |
43.3 |
0.77 |
2.1 |
9.00 |
24.9 |
8.17 |
22.6 |
2.58 |
7.1 |
|
Czernica |
60.50 |
60.53 |
22.72 |
21.0 |
0.33 |
0.5 |
36.20 |
76.3 |
- |
- |
1.28 |
2.1 |
|
Radzynska Struga |
16.50 |
16.47 |
4.37 |
26.5 |
0.30 |
1.8 |
10.35 |
62.8 |
0.10 |
0.60 |
1.35 |
8.2 |
|
Cienica |
65.00 |
65.51 |
47.02 |
71.8 |
0.37 |
0.6 |
14.31 |
21.8 |
1.66 |
2.50 |
2.15 |
3.3 |
|
Debogora |
20.50 |
19.51 |
7.89 |
40.4 |
0.53 |
2.7 |
9.92 |
50.8 |
- |
- |
1.17 |
6.0 |
|
Jeziorna |
4.20 |
4.31 |
1.98 |
25.1 |
0.15 |
3.5 |
0.88 |
20.4 |
0.10 |
2.3 |
1.20 |
27.8 |
|
Myszkowski
Row |
- |
3.50 |
2.07 |
59.1 |
0.10 |
2.9 |
1.15 |
32.9 |
- |
- |
0.18 |
5.1 |
|
Overall |
207.80 |
206.0 |
101.7 |
49.3 |
2.55 |
1.90 |
81.81 |
39.9 |
10.03 |
4.9 |
9.91 |
4.8 |
Table 3. Mean
yearly biogen loads incoming and outgoing from Lake Slawskie (kg/year) within
the period under study 1999-2003
|
Components |
Symbol |
kg /year |
|
|
P |
N |
||
|
Phosphorus and nitrogen load drained into the lake with sewage
originating from point sources |
(Iś) |
none such |
|
|
Phosphorus and nitrogen load brought in by inhabitants and tourists
within unsewered area of the direct
catchment basin |
(Il) |
8,568.4 |
53,552,7 |
|
Phosphorus and nitrogen load from spatial sources in the direct
catchment basin |
(Ip) |
756.5 |
16,594,1 |
|
Phosphorus and nitrogen load brought in by bathing people |
(Ik) |
8.5 |
170,0 |
|
Phosphorus and nitrogen load resulting from utilisation of roads
within the catchment |
(It) |
1.8 |
3,6 |
|
Phosphorus and nitrogen load brought in by rain- and snowfall |
(Ia) |
1,684.0 |
9,971,0 |
|
Phosphorus and nitrogen load drained into the reservoir with affluent
waters |
(Id) |
25,432.4 |
47,486,5 |
|
I = I ś + Il + Ip + Ik+
It + Ia + Id |
36,451,6 |
127,778.0 |
|
|
Within the lake’s depth |
21,500,0 |
76,110.0 |
|
|
Within bottom residue and biocenosis |
50,277,6 |
182,367.4 |
|
|
Outflow from the Lake |
7,674,0 |
21,520.5 |
|
Table 4. Estimation
of degradation vulnerability of Lake Slawskie in the period 1999-2003
|
Coefficient |
Coefficient value |
Category of vulnerability |
Category |
Point Score |
||
|
I |
II |
III |
||||
|
Mean depth [m] |
5.2 |
≥10 |
≥5 |
≥3 |
II |
2 |
|
V, Lake [m3] L, Lake [m] |
1.73 |
≥4.0 |
≥2.0 |
≥0.8 |
III |
3 |
|
% of water stratification |
0 |
≥35 |
≥20 |
≥10 |
IV |
4 |
|
P, active bottom [m2] V, epilimnion |
0.19 |
≥0.10 |
≥0.15 |
≥0.30 |
III |
3 |
|
% of water exchange per year |
50 |
≤30 |
≤200 |
≤1000 |
II |
2 |
|
Schindler’s coefficient P, Catchment [m2]+ P, Lake V, Lake |
4.9 |
≤2 |
≤10 |
≤50 |
II |
2 |
|
Method of management of direct catchment [%] |
Arable land - 24.0 Forests - 36.0 Lake - 20.6 Others -19.4 |
≥60 of forests |
<60 of forests <60 of arable land |
≥60 of arable land |
I |
1 |
|
Total
degradation vulnerability category [Cat. I: 0.8 points, Cat. II: 0.9-1.6 points,
Cat. III: 1.7-2.4 points, Cat. IV > 2.4 points] |
IV |
2,43 |
||||
Table 5. Actual,
permissible and hazardous yearly phosphorus and nitrogen loads in Lake Slawskie
|
Year |
Phosphorus values [mg P/m2/year] |
Nitrogen values [mg N/m2/year] |
Hazard category |
|||||
|
1 |
2 |
3 |
1 |
2 |
3 |
P |
N |
|
|
1999 |
0.34 |
0.052 |
0.104 |
1.95 |
1.5 |
3.0 |
III |
I |
|
2000 |
0.32 |
0.051 |
0.102 |
1.78 |
1.5 |
3.0 |
III |
I |
|
2001 |
0.74 |
0.052 |
0.104 |
1.44 |
1.5 |
3.0 |
III |
I |
|
2002 |
0.82 |
0.049 |
0.098 |
2.13 |
1.5 |
3.0 |
III |
I |
|
2003 |
0.29 |
0.059 |
0.118 |
1.63 |
1.5 |
3.0 |
III |
I |
|
Mean |
0.50 |
0.052 |
0.104 |
1.79 |
1.5 |
3.0 |
III |
I |
Explanation:
1 - actual, 2 - permissible, 3 - hazardous
Table 6. Contribution
of individual sources before and after application of accessible measures
|
Source of contaminants |
Present |
Following application of
measures, no interference
within the lake’s sheet of water |
||||||
|
P kg/year |
% |
N kg/year |
% |
P kg/year |
% |
N kg/year |
% |
|
|
Inhabitants and tourists |
8,568.4 |
23.51 |
53,552.7 |
41.91 |
0 |
- |
0 |
- |
|
Spatial sources |
756.5 |
2.08 |
16,594.1 |
13.00 |
0 |
- |
0 |
- |
|
Bathing people |
8.5 |
0.02 |
170.0 |
0.13 |
0 |
- |
0 |
- |
|
Utilisation of roads |
1.8 |
0.00 |
3.6 |
0.00 |
0 |
- |
0 |
- |
|
Rain- and snowfall |
1,684.0 |
4.62 |
9,971.0 |
7.80 |
1,684.0 |
36.34 |
9,971.0 |
21.28 |
|
Affluent waters |
25,432.4 |
69.77 |
47,486.5 |
37.16 |
2,950.0 |
63.66 |
36,890.0 |
78.72 |
|
Total |
36,451.6 |
100 |
127,777.9 |
100 |
4,634 |
100 |
46,861 |
100 |