Marek
KOTT, Bogumiła WNUKOWSKA
Wrocław University of
Technology, Institute of
Electrical Power Engineering
The computer
simulation of energy-consuming factors in chosen industry branches
Abstract. The assurance for the delivery of
energy is the basis of economic development. There are connections between the
economic development of given country, the quality of life and energy
consumption. To make an electric power system work properly, it is essential
that a well developed industry produces energy-saving, competitive products. The dynamic transformations of economy in
Poland and steels growing prices of energy supports in last decade caused major
increase of interest of limitation of energy-consuming by business enterprises.
One of the most important factors, which
permits estimate the condition of industry is the energy-consuming
factor and forecasting this index allow planning the strategy of national
industry. In this paper was presented
the way of forecasting the energy-consuming factor in chosen
industry branches.
Keywords: energy,
industry, analysis.
Introduction
Fast social-economical development can be observed in Poland in recent
years and it has required the assertion
for the delivery of energy in proper quantities and quality allows for
more precise ecological norms. One of the most important problems is assurances
of equilibrium for power industry policy. The effective activity of the
social-economical should be based on gain information about economy. This
information should be used to technological forecasting, simulation and finally
to make the best decision of future power industry. If we know the most
important factors which forming energy demand, specially in industry, we can
foresee the development of this economy sector. The most interesting factor,
which can valuate condition of industry, is energy-consuming factor. In Poland,
in some branch of industry, this factor is higher (double, treble) then in
Western Europe cantries.
Situation of power engineering in Poland
The Polish industry is characterized by energy consumption rise. It is
caused by dynamic development of national economy. In spite of growth demand on electric energy in all
sectors of economy, the industry is the
largest energy consumer. Polish industry uses 55% electric energy which is
produced in country (fig. 1).
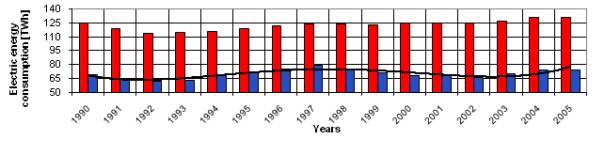
Fig. 1. The electric energy consumption in
Poland generally (red) and in industry (blue) in 1990 – 2005 [7]
The structure of consumption in particular energy supports is changing. In
the last fifteen years, hard coal consumption was reduced by about 30% and is
now 68 million tones per year (fig. 2). It increases however with natural gas
consumption (fig. 3).
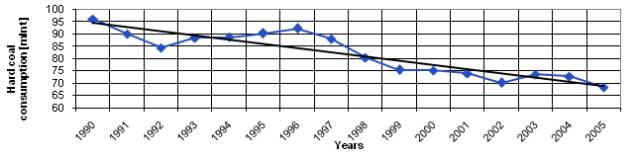
Fig. 2. The hard coal consumption in industry in
1990 – 2005 [7]
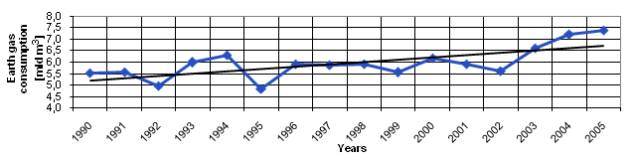
Fig. 3. The earth gas consumption in industry in
yeras 1990 – 2005 [7]
This
is connected with ecology, because natural gas emits less pollution than coal
(tab. 1). The enlargement of gas consumption requires the logging of him from
foreign supplier by steels growing prices of this support.
Tab. 1. The emission of natural gas air pollution in comparison with
hard coal [3]
|
Name |
Unit |
Hard coal |
Natural Gas |
|
Carbon dioxide |
% |
100 |
55 |
|
Sulfur oxide |
% |
100 |
0 |
|
Nitric oxide |
% |
100 |
40 |
After 1989,
the restructuring of industry was conducted. This influenced electric energy
consumption in individual branches of industry. The characteristic factors are
shown in figure 4. One can notice a increase electric energy consumption factor
in industry per one worker. The perfect example is Metal industry for which
this factor increased three times. There is many factors which can show
condition of industry: the energy consumption factor, electric energy
consumption factor in industry per one worker factor, but one of the most
imported is energy-consuming factor. The
forecasts of this factor permit to define the competitiveness of national
industry and to compare it with Western Europe countries industry.
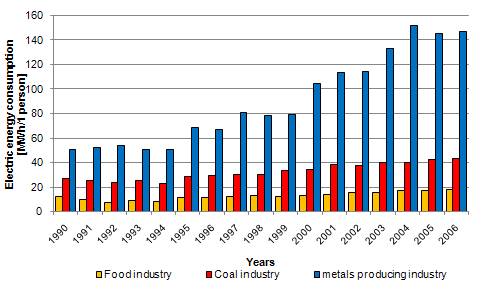
Fig. 4. The electric energy consumption factor
in industry per 1 worker in 1992 – 2005 [7]
The
forecasting with econometric models
One of the most popular simulation method is the cause-effect models
building. It depends on searching
dependence between variable which is explain (the energy-consuming factor in chosen branch of industry) and the
explanatory variables ( the sold production, employment, number of companies,
in chosen branch of industry). This models are called econometric or in special
occasions energy-metric models. The linear model with many explanatory
variables has figure:
(1) 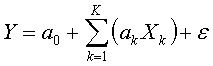
where:
Y –
variable which is explain,
Xk – k explanatory variables for k =
1, 2 …K,
a0,
ak – structure model parameter for k =
1, 2 …K,
ε
– random component.
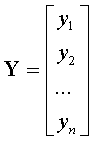
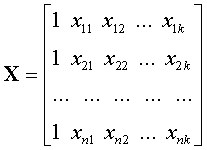
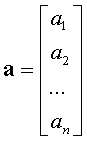
To determinate the individual
parameters of econometric model is the most comfortably to use classic method
of the smallest square. To performance this method is
introducing symbol matrix, where:
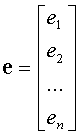
·
the variable explain vector
·
the explanatory variables matrix
·
the structure parameters vector
·
the remainder model vector
The structure parameters vector has
calculate by formula:
(2) ![]()
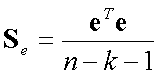
and the variance and covariance structure
parameters matrix is specified by formula:
(3) ![]()
where:
Se – the
variance random deviation matrix which is estimate by formula:
(4) 
So that prepared model permits on undertaking next steps in analysis of
energy-metric model which is introduce on figure 5.
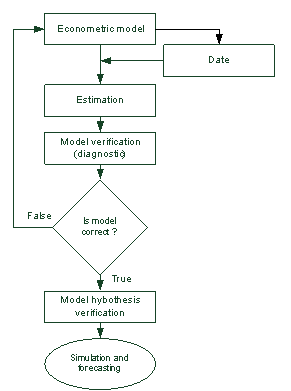
Fig.
5. Econometric analysis diagram [2]
The next step is model verification. The estimators ai
should be effective and have
to meet Gauss-Markov assumption:
·
relation between variable which is explain and
explanatory variables have linear character
·
value of explanatory variables are steady (not
random)
·
random parameters ε for
postvaccinal value of explanatory variables have normal distribution witch
constant variance and the expectation value equal zero.
·
random component are not correlated
The
last step in analysis of econometric
model is inference on this model. It is discriminate three kinds of forecasts:
·
point
forecast,
·
interval forecast for value of explain variable y,
·
interval forecast for expected value of explain
variable y.
In
the next point are presented energy-metric models for three chosen of branch of
industry. All necessary data to construction models are from The Statistic
yearbook published by Central Statistical Office of Poland.
Simulation of energy-consuming factors in chosen
industry branches
The energy-consuming factor means amount of electric energy which is use to
produce 100 PLN sold production. Three
industry branches was chosen to
present: metals producing industry, coal industry and food industry. The metals
producing industry is a part of economy which include: cast iron, steel, iron
alloy, noble and base metals production, cast iron founding and cast iron or
steel pretreatment. The coal industry include output material and preparation
to enrichment for other industry branches. The last industry is food industry
which produce and prepare foodstuffs. This three branches used 29% electric
energy which was produced in Poland in 2006:
·
metals producing
industry 13%,
·
coal industry 10%,
·
food industry 6%.
The most important date are introduce
on table 2.
Tab. 2. The staple chosen
industry in 2006 [7]
|
|
food
industry |
coal
industry |
metals
producing industry |
|
Number of
company |
1544 |
117 |
166 |
|
Sold
production [mln PLN] |
91 260,7 |
33 647,8 |
27 549,6 |
|
Investment
expenditure [mln PLN] |
6 720,7 |
3 650,2 |
2 516,3 |
|
Employment [thousand workers]
|
292,0 |
181,0 |
61,5 |
|
Energy
consumption [GWh] |
4 359 |
6 170 |
9 687 |
|
energy-consuming factor [
kWh/100PLN*] |
5,3 |
27,8 |
31,1 |
* Energy consumption per 100 PLN sold
production
After deeply date analysis
was proposed linear energy-metric models for chosen industries, where variable
which is explain is energy-consuming
factor and explanatory variables are number of company, sold production,
employment and energy consumption.
To prepare this models was used digital-circuit
engineering. On market is a lot of computer programs which used classic
smallest square method. This method use programs for specialist (Gretl, Forecast
PRO Unlimited, STAT-EK) or common
programs (MS Excel, STATISTICA). At professional literature you can find a lot
of information who prepare model correctly and who check it. The final effect
are models which are presented below:
· for metals producing industry
(6) ![]()
· for coal industry
(7) ![]()
·
for
food industry
(8) 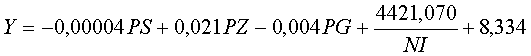
where:
Y - energy-consuming
factor [ kWh/100PLN*],
PS - Sold production [mln PLN],
PZ – Employment [thousand workers].,
PG - Number of
company,
NI – Investment expenditure [mln PLN]
This
energy-metric models are base to prepare medium-range forecast for energy-consuming factor until year 2015.
Determination factor for all presented models is higher then 83%, relative
forecasting error is 4,6% and maximal relative error 9,8%. Small forecasting
errors means that all models are correctly prepare and it is possible to build
forecasts for this branches of industry.
a)
b)
c)
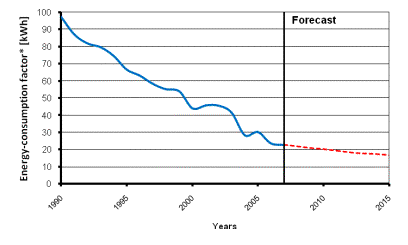
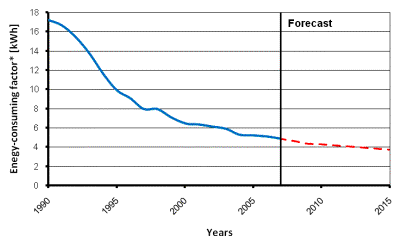
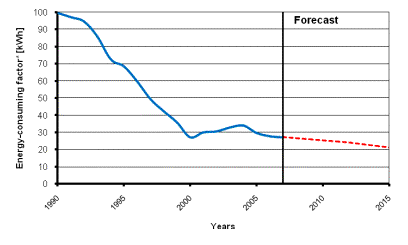
Fig. 6. The energy-consuming factor forecasts
for a) metals producing industry,
b) coal industry, c) food industry
in 1990 -2015
* Energy consumption per 100 PLN sold production
Summary
The presented energy-metric models show that
energy-consuming factor decrease but it is possible to see decrease rate will
be lower in the future. To change this fact the industry should:
·
exchange energy-consuming and
material-consuming technologies to modern and energy-saving technologies,
especially in heavy industry,
·
magnify work productivity with a better organization of production and
exploitation,
·
introduce a suitable legal-economic
settlement, which will promote energy-saving and ecology technologies,
·
allow the Polish government to
promote, by suitable legal means, saving energy.
LITERATURE
[1]
Gładysz B., Mercik J.: Modelowanie
ekonometryczne. Studium przypadku, Oficyna
Wydawnicza PWr, Wrocław, 2007.
[2]
Guzik B.: Podstawy
ekonometrii, Wydawnictwo Akademii Ekonomicznej w Poznaniu, Poznań,
2008.
[3]
Ney R.: Ocena zasobów energetycznych Polski, Elektroenergetyka nr 1, (2002).
[4]
Luszniewicz A.: Statystyka z pakietem komputerowym STATISTICA PL, Wydawnictwo C.H. Beck, Warszawa, 2003.
[5]
Pyk J.: Szanse i zagrożenia rozwoju rynku energetycznego w
Europie i Polsce, Wydawnictwo Akademii
Ekonomicznej w Katowicach, Katowice, 2007.
[6]
Radzikowska B.: Metody prognozowania – Zbiór zadań, Wydawnictwo Akademii Ekonomicznej we
Wrocławiu, Wrocław, 2004.
[7]
Rocznik
statystyczny przemysłu, GUS,
Warszawa 1990-2007
[8]
Snarska A.: Statystyka Ekonometria Prognozowanie, Wydawnictwo Placet, Warszawa, 2005.
[9]
Winston W. L.:
Microsoft Excel. Analiza
i modelowanie, ZP-Poligrafia,
Warszawa 2005.
_____________
Autors: mgr inż. Marek Kott, E-mail: marek.kott@pwr.wroc.pl.;dr hab. inż. Bogumiła
Wnukowska, E-mail: bogumila.wnukowska@pwr.wroc.pl, Wroclaw University of Technology, Institute of Electrical Power Engineering, 27 Wybrzeze Wyspianskiego Street , 50-370
Wroclaw.