Inna N. Pakholkina, Anna Y. Gorlach
Samara State Aerospace University (SSAU), Samara, Russia
STATISTIC
IMITATIONAL MODELLING FOR RISK ASSESSMENT IN LEAN MANUFACTURING INVESTMENT
PROJECTS
Lean manufacturing concept represents a product development, supplier
and customer relations management system with a customer-oriented production,
which allows developing a product that meets customer needs and has fewer
defects compared to mass production products. Lean manufacturing systems make
it possible to reduce labor and capital costs and make a product less
time-consuming.
Lean manufacturing models benefit companies’ competitiveness through:
·
Minimizing production cycle time;
·
Reducing costs of production program
fulfillment;
·
Raising order handling and product
quality.
Implementing lean manufacturing adds to company’s ability to grow,
reduce production costs and work up a market. Nowadays it is crucial for
companies to become more effective, and since lean manufacturing does not
require expensive innovations but reasonable usage of organizational potential,
it becomes a beneficial and appealing system.
But still there are definite risks associated with lean manufacturing
concept implementation. As it requires the products to be more
customer-oriented and produced not in bulks but more individually, it makes it
impossible to stock raw materials for flawless production and thus makes all
the successive production stages dependent on the fulfillment of the preceding
ones. All this accounts for the risk of project fulfillment delay. And for the
money purchasing power decreases with the lapse of time, long-dated investment
projects may become risky in terms of net present value reduction.
In the following paragraphs we’ll show the use of lean manufacturing in
short-haul passenger aircraft development, and assess the risk of net present
value reduction by more than 10% of projected figure.
The project stages with their planned duration and cost are listed below
in Chart 1, and the arrow diagram is shown as Image 1. The purchase price of
the finished product is 900 million rubles.
Chart 1 – Project stages
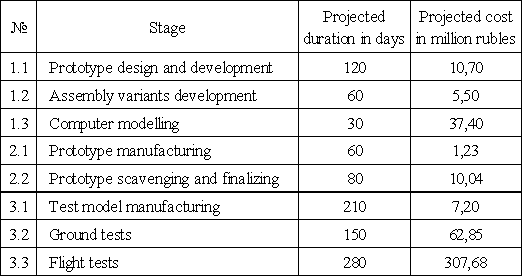
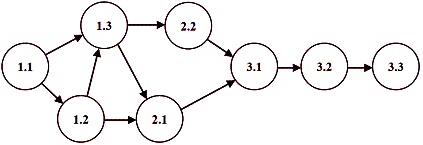
Image 1 – Arrow diagram of the project
Net present value of the project is calculated by the 13% discount rate.
Discounting is accurate within 1 day, using the following formula:
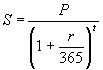 (1)
(1)
where S – discounted value,
P – nominal value (costs or revenue),
r – discount rate (r = 0,13),
t – time from the day of project launch in days.
Cost of each stage is paid right before the stage starts, and the purchase
price for the finished product is paid upon the last stage fulfillment.
Projected net present value of the project at issue is 275.28 million
rubles.
We’ll consider the highest possible deviation of project stages duration
and cost to be ±20%
of the planned value.
Random external factors influence is described by the following model,
which uses the normally distributed random numbers:
![]() , (2)
, (2)
where z0 – planned value,
γ – element of random numbers with normal distribution law,
kv – variation ratio for the parameter at issue (kv = 0,2),
z* – value
including random factors influence.
Statistic imitational modeling procedure includes, firstly, generating a
number of NPV values calculated for random factors influenced data, and
secondly, risk estimation by normal distribution law with the generated
statistical sample parameters. For data without any variation limitations apart
from variation ratio, the risk of the NPV reduction by more than 10% of the
projected value is estimated to be 0.29.
Adding some limitations to the model makes it possible to reduce the
risk level. For example, if the duration figures shown in Chart 1 are
considered to be pessimistic estimates (i.e. duration in the worst possible
conditions), the random factors influence is to be calculated using the formula
![]() (3)
(3)
This means that the duration can be only shortened by the random
factors, but can never be extended. With the absence of any further limitations
(e.g. for stages costs), the risk of the NPV reduction by more than 10% of the
projected value is estimated to be 0.22.
On the other hand, the costs figures may be considered as pessimistic
while the duration estimates stay realistic; in this case, costs variation is
calculated with formula (3) and duration variation by formula (2), and the risk
of the NPV reduction by more than 10% of the projected value is estimated to be
0.04.
Shall both parameters estimations be pessimistic (and thus their
variations calculated using formula (3)), the risk in question will be only
0.014.
Overall, putting restrictions on the parameters of the project can lower
the risk level considerably; investments restrictions are more effective than
time restrictions in terms of risk cutting.
Altogether, investment projects parameters calculations produced with
statistic imitational modeling proved the fact that, when processing long-dated
investments projects, it is crucial to make thorough planning and choose
parameters estimations carefully in order to minimize risks and raise stability
and effectiveness.