Экономические науки/5. Управление трудовыми
ресурсами
Puhalska A. P., Chernysheva A., Zdanovskyi I.
Zaporizhzhyan National University, Ukraine
Analysis of
external migration of Ukraine
Globalized economy characterized by increasing scale of international migration,
which is becoming increasingly complex and directly or indirectly related to
the labor.
In the absence of developed capital markets and consumer loans to
individuals who wanted to start a business, start-up capital needed. The
transition to a market economy has created consumer demand for expensive goods
such as housing, cars, appliances and more. This has stimulated labor migration
by the end of 1990 has become a mass fact and a source of income for many
families [1]. The reason for the growth of its scale also facilitated by the
fact that the population of Ukraine has involved to international migration
processes during their global intensification. First of all the EU and Russia
rapidly growing demand for Ukrainian labor.
The primary mission of the survey is to determine the scale of labor
migration. The survey of labor migration done in 2012 found 1.2 million, or
3.4% of the population aged 15-70 that were working or looking for work abroad
from 1 of January 2010 to 17 June 2012. Among the working age population the
part of migrants in this period was 4.1% (from the beginning of 2005 till the 1
of June 2008 5.1% of people of working
age worked abroad, and since the beginning of 2007 until June 1, 2008 – 4,4%).
Among all labor migrants almost half (48.5%) were short-term migrant
workers, more than a third were people who returned to Ukraine and only every
seventh labor migrant working abroad more than 12 months. However, in the last category
more women than men and urban than rural habitants [2].
Only few migrants abroad are able to get a job that corresponds to their
skill level, almost all of them regardless of education level work in low
skilled jobs. In the situation of the inconsistencies, workers’ skills and the job
they do abroad Ukrainian labor migration at least to some extent may be
described as a "brain drain". This disparity is also evident when
data on branches of employment of migrants abroad (Figure 1) compared with
their level of education (Figure 2) [3]. However almost all those who had the
experience of labor migration found a decent paying job because of previous
agreements on employment. This is an evidence of a high efficiency of efforts
of the economically active population of Ukraine in order to seek job abroad.
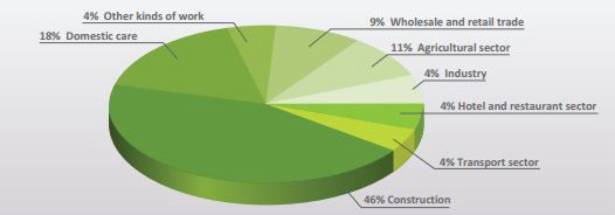
Figure 1. Main Employment Areas of Ukrainian Labor Migrants
(2010-2012).
[4]
It is notable that women labor migrants are better educated than men are.
Studying is 12.5 years among women however it is 11.8 years among men. The
share of persons with higher education (all levels) among women is almost twice
higher than among men.
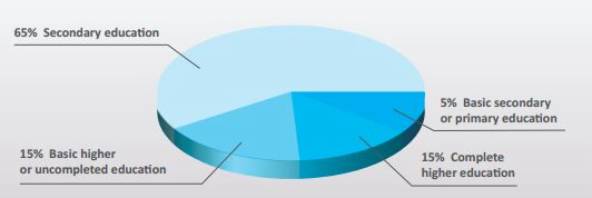
Figure 2. Education Level of Ukrainian Labor Migrants (2010-2012). [3]
The largest share of labor migrants with higher education (89.6%) had
emigrated to Germany. In Hungary and Spain, with this level of education was
one in five migrant workers. A large proportion of migrant workers with
complete secondary education were observed in Portugal (93.5% of all migrants)
and in Belarus, the Czech Republic and the Russian Federation, the figure ranged
from 72.1% to 76.7% (Table 1).
Table 1. Labor Migrants by Host Countries and Education Level
(2010 – 2012).
[2]
|
|
Total, thousand of people |
by education level |
|||
|
complete
high education |
basic
high education |
complete
secondary education |
basic
or beginning secondary education |
||
|
Quantity
of labor migrants, total |
1,181,6 |
15,4 |
15,1 |
64,9 |
4,6 |
|
by
amount of represented |
|||||
|
Russian
Federation |
511,0 |
12,5 |
10,0 |
72,1 |
5,4 |
|
Poland |
168,4 |
12,4 |
18,0 |
61,8 |
7,8 |
|
Italy |
156,0 |
14,9 |
28,7 |
54,0 |
2,4 |
|
Czech Republic |
153,0 |
9,5 |
11,1 |
74,1 |
5,3 |
|
Spain |
52,6 |
19,8 |
33,3 |
46,9 |
- |
|
Germany |
27,8 |
89,6 |
3,2 |
7,2 |
- |
|
Hungary |
23,0 |
19,6 |
14,3 |
66,1 |
- |
|
Portugal |
21,7 |
- |
6,5 |
93,5 |
- |
|
Belarus |
21,5 |
- |
23,3 |
76,7 |
- |
|
Other
countries |
46,6 |
42,3 |
16,3 |
38,2 |
3,2 |
The vast majority of those who carried out the pre migration educational
training or language courses were 78.9 % and only 29.8 % - attending highly
specialized courses aimed at obtaining certain skills, professional knowledge,
and
9.9 % in
exchange curriculum within the University College. Foreign language studied
more men than women and they represented by the following countries: Italy,
Czech Republic, Portugal and Poland [2]. Among other things, it is worth noting
that workers have studied the science of agriculture, navigation courses and /
or English for Seafarers indicating possible future economic activities in the
migration countries.
The study surveyed Ukrainian migrants who departed for Australia,
Canada, New Zealand and the United States, revealed gender and age differences
on intention of emigration (Figure 3). Emigrants departing for Australia,
Canada, New Zealand and the U.S. - most people under the age of 30 years (64%),
women (64%), with higher education (56%) and were going to emigrate to
permanent residence
(25 %) [3]. The survey confirmed that travel
to distant overseas countries to carry residence fulfill primarily young and
educated Ukrainians. According to the data
Ukrainian emigrants mostly would be employed in the fields of education,
culture, science, retail and services, or were students.
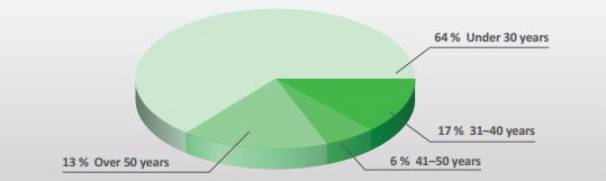
Figure 3. Age Characteristics of Ukrainian Emigrants (2011).
[3]
The main reasons for emigration to Australia, Canada, New Zealand and
the United States are family reunification (40%), education (21%), employment
(21%), other 18%, while migration to the EU and Russia mainly focused on
employment.
Historically, Ukraine has one of the largest Diasporas in the world.
There are various difficulties to define the number of people belong to Diaspora.
Total number of Ukrainian Diaspora varies between 12 and 20 million of people
(Figure 4).
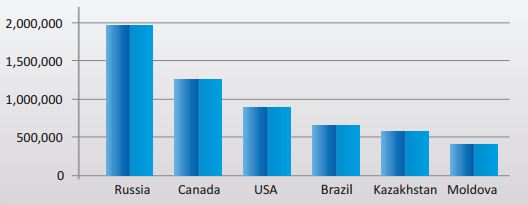
Figure 4. Ukraine Diaspora, Main Countries
(2010 – 2012). [5]
The largest recipient countries of domestic labor is the Russian
Federation (43.2%), Poland (14.3%), Italy (13.2%) and Czech Republic (12.9%) (In
examining migration 2008 second and third place among those countries occupied
Italy and the Czech Republic). Other countries where labor migration flows are
Spain (4.5%), Germany (2.4%), Hungary (1.9%), Portugal and Belarus (by 1.8%).
Simultaneously, there are significant differences in the areas of
external labor migration of men and women. Thus, among the major recipient
countries domestic labor advantage observed among women migrating to Hungary
(53.0%) and especially significant to Italy (78.5%). Among workers in Belarus,
Poland and Spain dominated by men, but the proportion of women is much higher
here than in all migration flows. Russia and the Czech Republic is a country
predominantly male migration from Ukraine (83.8% and 75.1%, respectively).
There are also differences in the countries of destination - the
habitants of urban areas and rural residents of Ukraine. While citizens in
their migratory journeys look for Spain and Portugal, and in particular - in
Germany, the villagers strongly dominated among migrating to Hungary, the Czech
Republic and Belarus. External labor migration in Ukraine mostly cyclical and
seasonal.
Thereby, abroad labor migration of Ukraine is today the most widespread
and socially significant migration flows, which affects the demographic situation,
labor market, economic development and social services, welfare of citizens,
poverty and social stratification, family relationships, and child rearing, has
numerous psychological, ideological, cultural and other impacts. The problems
of this migration require correspond responses by means of migration,
socio-economic, foreign policy and human rights.
References:
1.
Малиновська О. А.
Трудова міграція: соціальні наслідки та шляхи
реагування [Електронний ресурс] / О.А. Малиновська . – К. : НІСД, 2011. – 40 с.
- Режим доступу: http://www.niss.gov.ua
2.
Звіт щодо методології, організації проведення
та результатів модульного вибіркового обстеження з питань трудової міграції в
Україні [Електронний ресурс] / Міжнародна організація праці. Група технічної
підтримки з питань гідної праці та Бюро МОП для країн Центральної та Східної
Європи — Будапешт МОП, 2013. – Режим доступу : http://ukrstat.org/uk/druk/publicat/kat_u/publ11_u.htm
3.
Міграція в Україні: факти і цифри
[Електронний ресурс] / Міжнародна організація праці. Міграція для загального
блага. Представництво в Україні.-Друге
видання, 2013. – Режим доступу: http://iom.org.ua/ua/pdf/UKR%20FF_F.pdf
4.
Кириленко О.М.
Розвиток міграційних процесів в Україні. [Електронний
ресурс] / О.М. Кириленко, В.О.
Ільєнко –Режим доступу: https://www.google.com.ua/url?sa=t&rct=j&q=&esrc=s&source=web&cd=3&cad=rja&uact=8&ved=0CDoQFjAC&url=http%3A%2F%2Firbis-nbuv.gov.ua%2Fcgi-bin%2Firbis_nbuv%2Fcgiirbis_64.exe%3FC21COM%3D2%26I21DBN%3DUJRN%26P21DBN%3DUJRN%26Z21ID%3D%26IMAGE_FILE_DOWNLOAD%3D1%26Image_file_name%3DPDF%2Fppei_2013_37_12.pdf&ei=E6xNU-azKai6yAPgvYBI&usg=AFQjCNF0NvOpp9B_9jxMukMiBuglMHe_oA
5.
Міністерство
закордонних справ України [Електронний
ресурс] / Режим доступу: http://mfa.gov.ua/ua/about-ukraine/ukrainians-abroad