Политология/2. Политическая конфликтология
PhD in
Political Science Polyakov E.M.
Voronezh State University, Russia
Terrorism and structural
violence in post-soviet Russia
The concept
“structural violence” was proposed by J. Haltung 45 years ago [1, 168-187]. Two years later
together with T. Høivik he described the structural violence (hereinafter – SV) as a situation “whenever
people die, are injured or have other deprivation due to poverty and injustice
of social, economic and political institutions, systems or structures”. [2,
73-76]. They also proposed to measure the structural violence relying on data
on life expectancy.
Other
scientists, G. Köhler and N. Alcock, proposed two models of measuring the
magnitude of SV [3, 343]. They specify a null-model which represent a
hypothetical state of affairs without SV, what required an answer for question:
how many deaths would be avoided, if all countries enjoined the same living
conditions as Sweden (the “Swedish model”) or if the currently available global
wealth had been equally distributed around the world (the “Egalitarian model”)?
G.
Köhler and N.Alcock proposed the following formula to give an answer to a
question, according to the Swedish model:
V1 = Pn / En –
Pn / Es (Equation 1),
where Pn – the country's population N, En –
life expectancy for country N, Es – Swedish life expectance [3, 345].
Based on this
methodology and official statistics [4], we should try to calculate the
proportion of SV in post-soviet Russia and compare the number of deaths, caused
by SV with the number of deaths, caused by political terrorism. As model
regions we should take the Republic of Dagestan and Republic of Ingushetia, because
their population has the highest life expectancy from 1990 until 1999 and from
2000 and until now, respectively. But in our analysis we will use data for two
decades only, i.e. 1990-1999 (Dagestan as model region) and 2000-2009
(Ingushetia as model region). All empirical data you may find in Appendix at
the end of this article.
Substituting
shown in Tables 1a and 1b data in Equation 1, we obtain the loss in population
from structural violence in Russia during 1990-1999 and 2000-2009, presented in
Table 2a and 2b, respectively [5, 25].
Мы можем отметить, что в начале 1990-х
годов соотношение потерь от структурного насилия и общей численности населения
в РФ было примерно 0,77 на тысячу жителей. По мере дестабилизации обстановки на
Северном Кавказе (в первую очередь, из-за осетино-ингушского конфликта) и с
началом первой войны в Чечне (1994-1996) это соотношение изменилось на 1,2 –
1,4, увеличившись примерно в два раза. В период между военными кампаниями (1996-1998)
оно снизилось, достигнув показателей начала десятилетия – 0,72. Из-за вторжения
Ш.Басаева в Дагестан соотношение подскочило до 1,01, и, начиная с 2000-х годов,
продолжило расти, достигнув пика в 2,0 к 2004 году. Затем мы опять наблюдаем
тенденцию к понижению, с результатом в 2009 году почти аналогичным 1999, а
именно 1,03 и постепенный рост в начале 2010-х годов до 1,38 (см. График 1).
С другой стороны, мы можем отметить
некоторое снижение числа преступлений, связанных с применением насилия, в
первую очередь, убийств и покушений на убийство. В 1990 году таких преступлений
было 15,6 тыс., в последующие пять лет их число удвоилось и оставалось на
данном уровне практически без изменений в течение десятилетия [6, 299]. Лишь с
середины 2000-х гг. мы наблюдаем снижение числа убийств; к 2010 году их число
сократилось до уровня 1990 года (см. График 2).
Также противоречивую динамику показывает
активность террористов. Согласно данным Г.Хана, приводимым в его публикациях, количество
террористических атак за 5 лет (2008-2012) колебалось в пределах от 373 до 583,
то увеличиваясь, то сокращаясь, без всякой видимой логики. Количество жертв
терактов также было в пределах нескольких сотен человек [7, 23]. Согласно же
российским официальным данным, пик террористической активности пришелся на 2005
год (203 случая), после чего количество нападений снизилось почти на порядок,
до 25-30 случаев за год. [8, 180].
Таким образом, мы можем говорить о том,
что в современной России примерное соотношение потерь населения от структурного
насилия, вооруженного насилия и террористических атак, составляет 2000 : 200 :
2.
Appendix.
График 1.
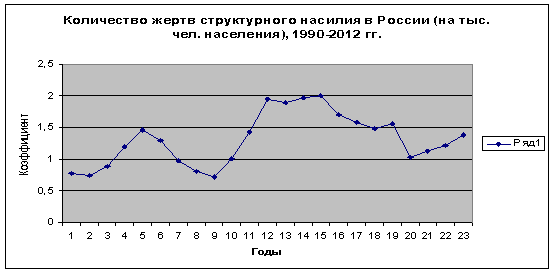
График 2.
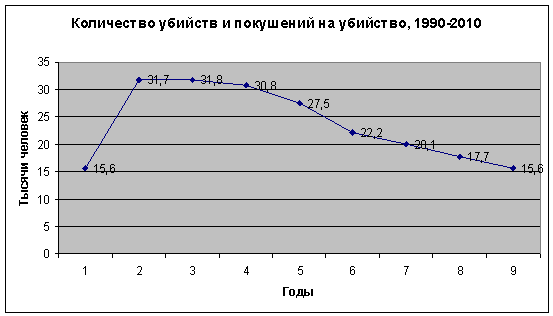
Table 1a.
Life
expectancy in various areas, 1990–1999 years.
|
|
1990 |
1991 |
1992 |
1993 |
1994 |
1995 |
1996 |
1997 |
1998 |
1999 |
|
Russia |
69,2 |
68,9 |
67,8 |
65 |
63,9 |
64,5 |
65,8 |
66,7 |
67,1 |
65,9 |
|
Dagestan |
73,1 |
72,6 |
72,1 |
70,5 |
70,5 |
70,4 |
70,3 |
70,5 |
70,5 |
70,6 |
Table
1b. Life
expectancy in various areas, 2000–2009 years.
|
|
2000 |
2001 |
2002 |
2003 |
2004 |
2005 |
2006 |
2007 |
2008 |
2009 |
|
Russia |
65,3 |
65,2 |
65 |
64,9 |
65,3 |
65,4 |
66,7 |
67,6 |
68 |
68,8 |
|
Ingushetia |
72 |
74,8 |
74,4 |
74,4 |
74,6 |
73,5 |
73 |
75,2 |
76,1 |
74,1 |
Table
2a. Magnitude of structural violence in Russia, 1990–1999 years.
|
|
1990 |
1991 |
1992 |
1993 |
1994 |
1995 |
1996 |
1997 |
1998 |
1999 |
|
Population,
millions |
147,7 |
148,3 |
148,5 |
148,6 |
148,4 |
148,5 |
148,3 |
148,0 |
147,8 |
147,5 |
|
Victims
of SV, thousands |
113,9 |
109,7 |
130,6 |
178,3 |
217,3 |
192,9 |
144,3 |
119,6 |
106,2 |
149,0 |
Table
2b. Magnitude of structural violence in various areas, 2000–2009 years.
|
|
2000 |
2001 |
2002 |
2003 |
2004 |
2005 |
2006 |
2007 |
2008 |
2009 |
|
Population,
millions |
146,9 |
146,3 |
145,7 |
143,5 |
144,2 |
143,5 |
143,2 |
142,9 |
142,7 |
142,7 |
|
Victims
of SV, thousands |
209,3 |
284,6 |
276,2 |
281,8 |
288,8 |
245,1 |
227,2 |
212,6 |
222,3 |
147,5 |
References:
1.
Haltung J. Violence, Peace and Peace Research // Journal of Peace Research,
1969, No 6.
2. Haltung J., Høivik T.
Structural and Direct Violence: A Note on Operationalization // Journal
of Peace Research, 1971, No 1.
3.
Köhler G., and Alcock N. An Empirical Table of Structural Violence //
Journal of Peace Research, 1976, No 4.
4. The data of
life expectancy in the Russian regions have been taken from Rosstat. Date Views 21.11.2013 http://www.gks.ru
5. Demograficheskiy Yezhegodnik Rossii (Russia’s Demographic Yearbook). –
Moscow: Rosstat, 2009.
6. Rossiyskiy statisticheskiy yezhegodnik
(Russian Statistical Yearbook). – Moscow: Rosstat, 2011.
7. See: Hahn G. Getting
the Caucasus Emirate right / A Report of the CSIS Russia and Eurasia Program. –
Washington, DC: CSIS, 2011.
8.
Rossiya v zifrakh (Russia in Figures). – Moscow: Rosstat, 2013.