Технические науки/3. Отраслевое машиностроение
Zhetesova G., Zharkevich O., Buzauova T
Karaganda State Technical University, Kazakhstan
Modeling and calculating welding
structures on the base of applied programs use
The
analysis of existing calculations of solidity of the elements of mechanized
mining complex shows that they are mainly based on the semi imperial formulas,
introduced in tabulating form or on the traditional calculating schemes of
resistance of materials. At the same time during the last years the concept
“The Fitness For Purpose” has gained the serious recognition, in its frame the
procedure of analysis was suggested, based on the combination of standard
material test and numerical computation with engaging contemporary approaches
of mechanic deformation and destruction. That’s why the problem of creation of
modern welding metal constructions, meeting the requirements of exploitation,
is closely connected with the development of précised methods of
calculation.
At the
heart of the creation of new system methods of calculation of metal construction support a
block-hierarchical approach is put. According to the position in the hierarchy
of description mathematical models are divided into models relating to micro-,
macro- and meta-levels (figure 1) [1].
The
totality of factors of interactions between mechanized mining complex and
mining rock is examined. The analysis of these factors is fulfilled according
to the chosen calculating schemes and life measurements.
On
macro- and micro- level the analysis of tension deformation status of elements
and components of metal constructions of the mechanized mining complex is
conducted. Constructional accordance of the real product and its model is
fulfilled on the base of the use of analysis calculus of approximation. The
calculation of the technological factors is done on the base of the description
of the real geometry of weld (with cold weld, constructional flaws and etc) and
registration of residual tension and warping. In the relevant methodology of engineering
the calculation of data isn’t reflected. The use of the methods of
micro-modeling let solve this task. At the same time three-dimensional model
(3D-KA- model) is used for the analysis of tension deformation status (TDS) of
metal construction as a whole, and two-dimensional model (2D-KA-model) is used
for the estimating on the micro-level the strength of weld with the calculation
of faults and technological factors.
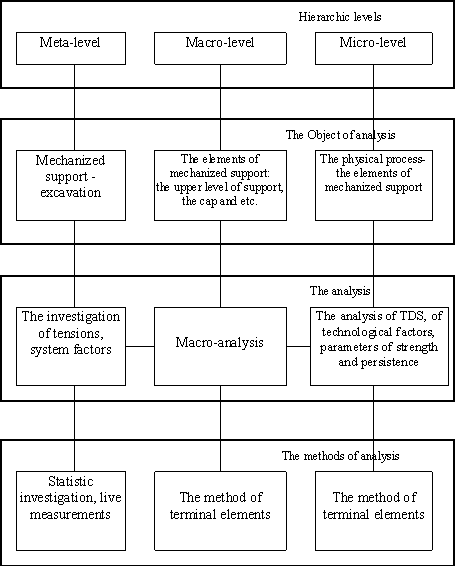
Figure 1 – Hierarchic levels and the methods of analysis
Different
types of the analysis of one-dimensional, two-dimensional and three-dimensional
structural models require special numerical methodology and computer algorithm.
The solving more complicated tasks make approach more exigently to the choice
of CAE – computer aided engineering, which is necessary for applying computer
analysis [2].
The
program ANSYS is the program, which main aim is to fulfill practically any
analysis with the help of the method of resulting elements. Today many leading
world corporations consider necessarily to have the program supplying by firm ANSYS. Powerful functional capability
of CAE , the system of ANSYS, let apply
it for solving solidity tasks such as to define the residual and operating
tension and deformation during the calculation of the strength of the metal
constructions. The peculiarity of the program is file compatibility for all
members of ANSYS family for all used platforms.
The
facilities of the analysis and optimization of the program are easily moved to
the models, created by the systems of preparation of engineering documents
(CAD) due to the use of format IGES and STEP for consignment of geometry or
appropriate interface of the leading CAD – systems such as CATIA, AutoCAD and
etc.
For the
viewing the results two postprocessors of program ANSYS can be used. The
general postprocessor is used for the analysis of the results one step of the
solving and provides getting line level, the picture of deformation condition,
the list of results, estimation of errors of calculation, carrying out the
calculation on the base of received data and so on. The postprocessor
of the process of loading is used for reviewing the results in specified points of rated model at every step of
the solution, one can get the graphics of the results as the function of time
so the frequency, the listing of the results, fulfill the arithmetic and
algebraic calculation.
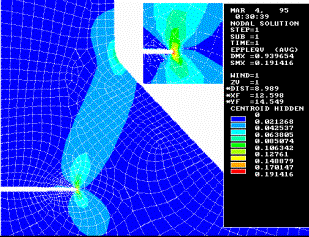
The
structure of file organization of ANSYS is given in figure 2.
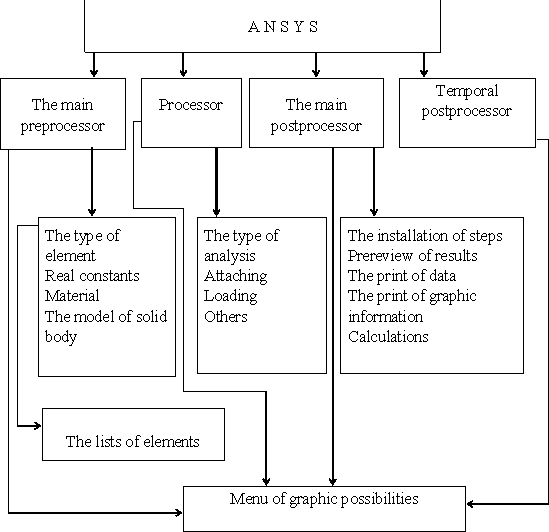
Figure 2 – The structure of program complex ANSYS
For the
enhancement of the methods of the analysis of weld it’s necessary to have exact
data about the tension and deformation in the section of junction in different
geometrical connections and applied loading. The correct understanding of forms
and size of the plastic zone, of the density of deformation in it and of the
evolution of these quantities in the process of growing of external loading let
define the laws of appearing and further development of the flaw in the zone of
thermal influence of weld processes. The use of numerical methods and powerful
calculating means have given the opportunity to get the distinct boarder,
separating plastic zone, besides tension-deformed state. The growth of the size
of the plastic zone before the top of the flaw leads to the necessity of
changing the linear mechanic of destruction to non-linear.
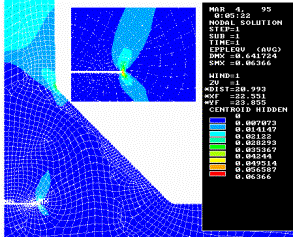
Let’s examine the distribution of tensions
and plastic deformation in the section of corner weld during the static loading, close to limit. The investigation
of regularities of elastic plastic deformation of welds was conducted on the
base of MKA. The model of the theory with the condition of fluctuating Miezes
at bilinear law of strengthening was used. The present model has mainly been
used for heavily deformed isotropic materials. In figure 3 the calculated scheme and main geometrical
parameters of cross junction are given.
|
|
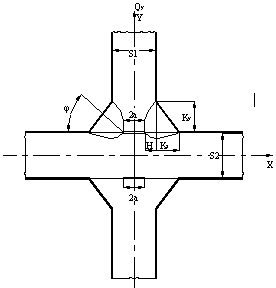
Figure 3 - Calculated scheme of cross junction
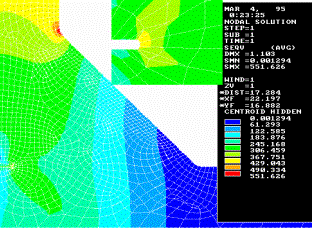
In figures 4, 5 and 6 the separate results
of calculating definition of this junction are given.
Material is the steel with the following
characteristics : σT = 260 MPa; E=2· 105 MPa; v=0,3; ET =
7350 MPa, where ET = parameter of strengthening non-linear area of
curved deformation.
Thicknesses S1 and S2 were invariable and equal to 18 mm. The size
of non-melting is 2a, cathetus Ky and Kz . Two variants of conditions in the direction of
axis Z were examined: 1) condition of flat tension state σz = 0; 2) condition
of flat deformation εz= 0.
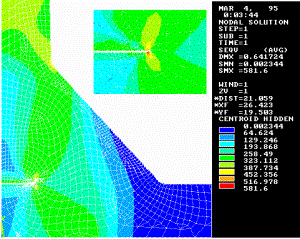
a)
b)
a) intension of tension; b) plastic
deformation
Figure 4 – Distribution of
tensions and plastic deformations in cross junction at the loading close to
limit, for the case of flat deformation
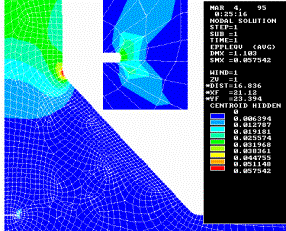
a)
b)
a)
intension of tension; b) plastic deformation
Figure 5 - Distribution of
tensions and plastic deformations at 2a = 4 mm
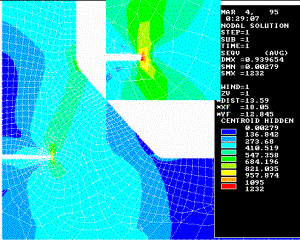
a) b)
a)
intension
of tension; b) plastic deformation
Figure 6 - Distribution of tensions and plastic
deformations at Кy= Kz =10 mm
Melting in these occasions was equal to H =
(S1 – 2a)/2 = 6 mm. The data of figure 4 correspond to the condition
εz= 0. The
investigation sets that the essential role in density of tension and deformation
in the top of non-melting is acted by its size in the direction of axis Y -
Δ (gap). The growth of the gap Δ from 0,1 to 2 mm makes an essential
influence on maximum quantity of σi and ![]() in the top of non-melting. So
in the top of non-melting. So ![]() changes from 6,3% to 3,6%. At
the same time average quantities of tension in the section φ = const are not changed considerably (from
346 MPa to 302 MPa).
changes from 6,3% to 3,6%. At
the same time average quantities of tension in the section φ = const are not changed considerably (from
346 MPa to 302 MPa).
The following analysis let specify that in
sections φ= const the
distribution of tension is far away from equal at φ < π/3. However
as early as φ > π/3 this unevenness considerably decreases which
is connected with intensive plastic current in these sections. Volumetric
tension state in the condition of flat deformation suggests the constrainness
of plastic current, that explains essential difference in density of σi and ![]() in the comparing variants. As
the consequence of this at flat tension state there is the increase of σi and especially of
in the comparing variants. As
the consequence of this at flat tension state there is the increase of σi and especially of ![]() .
.
The data of figures 5 and 6 illustrate the
influence of change of geometrical parameters of 2a, Kx, Ky on
the quantities σi and ![]() . It can be seen that the decrease of non-melting of 2a from 12 to 4 mm
(figure5) diminishes the value of σi approximately to 32% however
at the same time plastic deformations decrease considerably (at 1,9 times). The
reduce of the cathetus of the weld from 20 to 10 mm (figure 6) increases
sharply σi
and
. It can be seen that the decrease of non-melting of 2a from 12 to 4 mm
(figure5) diminishes the value of σi approximately to 32% however
at the same time plastic deformations decrease considerably (at 1,9 times). The
reduce of the cathetus of the weld from 20 to 10 mm (figure 6) increases
sharply σi
and
![]() till the meaning at which the
solidity is unreal. The decrease of the attitude Kx/Ky at the same sectional area of roller reduces
meanings of σi and
till the meaning at which the
solidity is unreal. The decrease of the attitude Kx/Ky at the same sectional area of roller reduces
meanings of σi and ![]() .
.
Consequently the following conclusion can
be made:
1. At loading welding
conjunctions with fillet welds by static load at the cross section appears the
volumetric tension state with the longitudinal tensions σz .
2. The essential
influence on the concentration of elastic plastical tensions and deformations
in the top of non-melting is made by size Δ. At the same time average
meanings σi and ![]() practically don’t change outside this area.
practically don’t change outside this area.
3. The degree of
coincidence of given facts let extend accepted conditions from the calculation
for further investigations.
Refarences:
1.
ANSYS
5.5 – Theory Reference: User’s Manual. – ANSYS,Inc., 1998. – 455 p.
2. Yamada Y., Yoshimura N., Sahura
T. Plastic Stress – Strain Matrix and its Application for the Solution of
Elastoplastic Problems by Finite Elements Method
// Int. J. Mech. Sci. – 1963. – Vol.10, № 5. – P. 643 – 654.