Современные информационные технологии/3. Программное обеспечение
Serkebayeva L.T
A.Baitursynov Kostanai State University, Kazakhstan
Analysis of
environmental data Deductor Academic
In the problems of ecology and wildlife are often considered
a set of observations on which you need to draw any conclusions. Similar observations can be quite a lot, and
there is the problem of their compact description using different targets and
timetables.
Consider the application of descriptive statistics in
Deductor Academic.
Step
1.
Creating the input data file. Initial data have been entered into a text
file and save it for further input into the program and their subsequent
analysis.
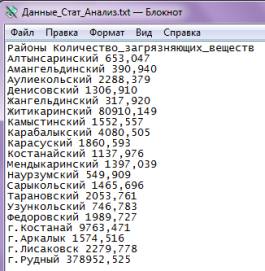
Picture 1 – source text file
Step 2.
Import text file data Deductor Academic. Run Deductor Academic. Using the Data Import
Wizard, import the data.
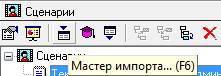
Picture 2 – Data Import Wizard
1 column "Areas" data type is
defined as a string, 2 column "amount of pollutants" data type is
defined as real. Next, choose how to display the following data: Table,
Statistics, Graphs.
Step 3.
Data Display Mode: Table, statistics,
histograms directly statistical analysis.
Table data display.
In data mode "Table" activate
the "Show Statistics online." Average number of pollutants in
Kostanai region in 2013 was 24,763.609 tons. Carry out filtering of data to
count the number of districts in which the number of contaminants below and
above the average for the region.
As a result, we find that in 18 of the 20
regions considered the amount of pollutants below the average for the area.
Accordingly, in 2 of the 20 regions this figure is above average. These include
Zhitikara area and Rudniy.
Display mode "Histogram"
In data mode "Histogram" you and
I can see the group in terms of "number of pollutants."
Grouping is produced in an amount of 5
slots.
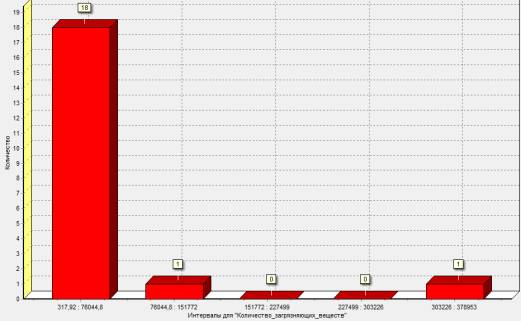
Picture 3 – display
mode "Histogram"
The amount of pollutants in the range of
317.92 to 76,044.8 tons have 18 districts of the region. The amount of
contaminants in the range of from 76044.8 to 151772 tons has 1 region. The
amount of contaminants in the range of 303,226 to 378,953 tons is 1 region.
The relevant data display modes can change
directions of the axes, data display options, types of graphs, labels and
values, interest, etc.
Literature:
1.
http://www.kostanai.stat.kz/ - Department
of Statistics Kostanai region
2. http://www.basegroup.ru - Website data analysis technologies