Современные информационные технологии/3. Программное обеспечение
Serkebayeva L.T
A.Baitursynov Kostanai State University, Kazakhstan
Data visualization environment Deductor Academic
Qualitative data visualization is an
important part of any analytical system. In many cases, expert enough to just
look at the data to make the necessary conclusions. However, the same data can
be displayed in many ways, and some of these will be most suitable will depend
on the problem being solved. Therefore, the user is offered a lot of mechanisms
Deductor visualization from which he can choose the best.
Deductor visualize data at any stage of
processing. The system will determine how she can do it. The user needs to
select the desired option from the list and adjust several parameters.
Consider the features of the analysis of
data in the data "table."
Let us import operation text file and
select the desired mode of data visualization. Input data is presented in
Picture 1.
Suppose we need to perform the following
operation analysis using the tool "Filtering": to display information
on zaemschnikah aged 25 to 40 years.
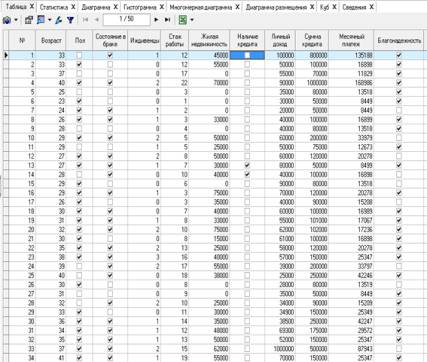
Picture 1 – initial data
To perform this operation in the data
"Table", select Tools ![]() - filtering and fill it as shown in Picture 2.
- filtering and fill it as shown in Picture 2.
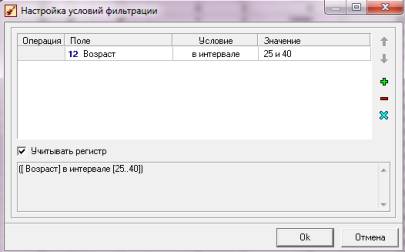
Picture
2 – Settings window filter conditions
Click "OK" appears
on the screen the desired list (Picture 3)
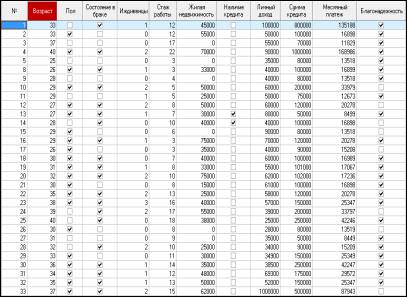
Picture
3 – The filtered data
Based on filtered data can be formulated
as follows: from 50 customers claimed 33 clients are in the category of age 25
to 40 years.
In order to remove all the conditions
necessary to open the tool "Filter" and remove all configured
conditions. Perform the following steps of the filter. You want to display
those customers, the number of dependents is equal to or more than 3. Click OK.
Get the result.
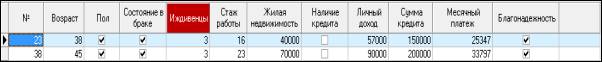
Picture
4 – filter results
Of the 50, only 3 clients satisfy the
stated conditions. Thus rendering mode "Table" displays the data with
the possibility of sorting, filtering and exporting.
Literature:
1. http://www.basegroup.ru - Website data analysis technologies