Современные информационные технологии/3. Программное обеспечение
Serkebayeva L.T
A.Baitursynov Kostanai State University, Kazakhstan
Features
imaging mode Statistics
In all actions Deductor Academic Data
Processing Analyst produces with only 4 operations:
- Import;
- Export;
- Treatment;
- Visualization.
One way to visualize the
"Statistics" displays statistics for all sample fields histogram
values. Consider the features of the analysis of data in the data
"Statistics". Let us import operation text file and select the
desired mode of data visualization. Input data is presented in Picture 1.
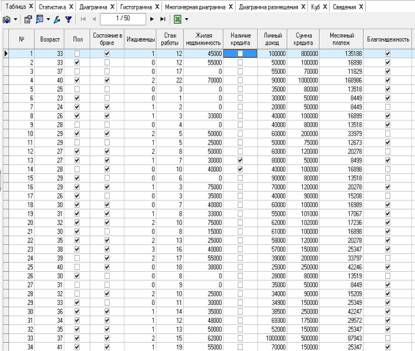
Picture 1 – initial data
We proceed to the display mode data
"Statistics". In the second tab is. Mode has the form shown in Picture 2.
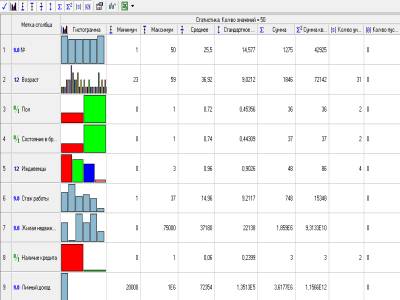
Picture 2 – Display mode "Statistics"
The figure displays all statistics for
baseline characteristics. You can adjust the display of some indicators by
pressing the corresponding buttons on the toolbar
![]() .
.
Suppose the analyst requires information
on the total amount of credits claimed for 50 clients. On the toolbar, set the
amount of Statistics. As a result, we obtain the requested information. The
total amount of lending is 7,619,000 tenge.
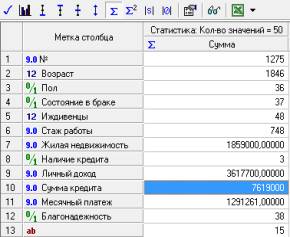
Picture 3 – Window "Statistics"
Also in the data "Statistics"
we can customize the display format by clicking on the button. Figure 4
illustrates the setup of the display format for the field
"Residential".
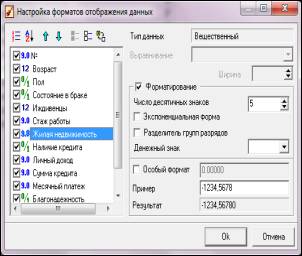
Picture 4 – Window settings
Thus, the data display statistics
allows the analyst to determine standard statistical indicators in just a few
clicks.
Literature:
1. http://www.basegroup.ru - Website data analysis technologies