Современные информационные технологии/3. Программное обеспечение
Serkebayeva L.T
A.Baitursynov Kostanai State University, Kazakhstan
Features
data visualization mode Histogram
Deductor visualize data at any stage
of processing. The system will determine how she can do it. The user needs to
select the desired option from the list and adjust several parameters.
Consider one of the ways of
visualizing data "Histogram". This scatter plot indicators. The
histogram is designed for visual evaluation of data distribution. Data
distribution has a significant impact on the model-building process. Is
built to detail histogram data.
Let us import operation text file and
select the desired mode of data visualization . 50 provides information on bank
customers . Activating histogram.
The histogram does not display the field
value , and the number of values belonging to a given interval.
By type of histogram can be used to judge the statistical distribution of
values in the field . If the columns of the histogram are
approximately the same height , the distribution is close to uniform , and if
there is a pronounced maximum , then the normal distribution. The horizontal
axis of the histogram are deposited intervals , and the vertical - the number
of values caught therein .
Suppose the analyst need information on
clients making monthly payments depending on certain amounts. Set box on the
record "monthly payment" and display the required data in the chart.
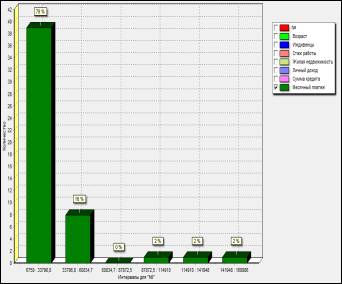
Picture 1 – Histograms window
Formulate the following conclusions: System
indicators grouped into 6 groups : Group 1 . Monthly payments from 6759-33796,8 (39 of 50
customers have payments from 6759 to 33796.8 tenge, which is 78% of the total
number of borrowers ) . Group 2 . Monthly payments from 33796,8-60834,7 ( 8 of
50 customers have payments from 33796.8 to 60834.7 tenge, which is 16% of the
total number of borrowers ) . Group 3 . Monthly payments from 60834,7-87872,5 .
Group 4 . Monthly payments from 87872,5-114910 . Group 5 . Monthly payments
from 114910-141948 . Group 6 . Monthly payments from 141948-168986 . Most
clients are small in magnitude the amount of monthly payments ( 78% of 100%).
Note that the number of slots and the
slots themselves along the field "age" are set in step 10 of process
16 in the text file import.
These settings can be changed by
pressing the button - ![]() display field. You see the "Setting the
chart." In this window, set the columns, type X axis labels and colors for
displaying the columns in the chart. If in the process of importing the source
data you make a mistake, you can change the data.
display field. You see the "Setting the
chart." In this window, set the columns, type X axis labels and colors for
displaying the columns in the chart. If in the process of importing the source
data you make a mistake, you can change the data.
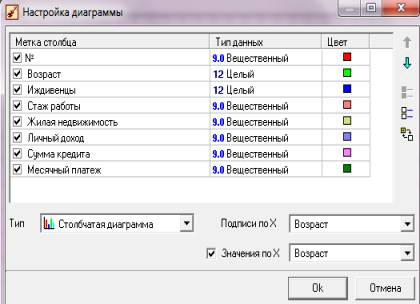
Picture
2 – Chart settings window
The presence of a large set of
visualization mechanisms makes it easy to conduct exploratory analysis, to
compare the results obtained using different processing mechanisms. Normally
the use of visualization mechanisms for its ease of application is the first
step in building a full-scale analysis system. Thus, Deductor provides the
opportunity to start with the most affordable method of analysis -
visualization and move eventually to systems with more powerful functionality.
Literature:
1. http://www.basegroup.ru - Website data analysis technologies