Современные информационные технологии/3. Программное обеспечение
Zhuaspaev T.A
A.Baitursynov Kostanai State University, Kazakhstan
Data analysis environment Deductor Academic
Operational analysis of information
about the activities of any organization, regardless of their form of ownership
is today the basis of acceptance, both operational and strategic management
decisions. Obviously, the "manual" methods of analysis of numerical
data in a reasonable amount of time, so the use of specialized analytical
platforms improves productivity of analysts.
Consider the possibilities of the
program for research Deductor Academic popularity among buyers of products of
different manufacturers. Assume that the results of the analysis required for
making decisions about future cooperation with the manufacturers of.
Initial data are as follows: are the
results of monies rescued trading organization from daily sales of three
manufacturers for two weeks.
Data were stored in a text file and
imported into the environment package.
When choosing a way to visualize the
data we consider three ways: table Cube.
Way to visualize the data table.
In the table, each field sample data is
located in a separate column. Columns entitled field labels, and if the label
has not been specified, the field names. Logical type columns are displayed as
checkboxes.
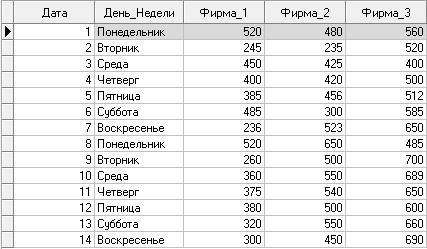
Picture
1 – Table
Suppose
we are interested in such analysis, as goods sold over the weekend. You need to
configure filtering of data as shown in Picture 2.
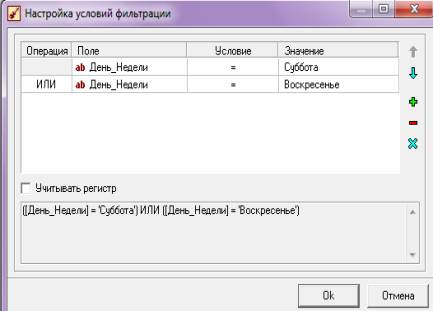
Picture
2 – Configure filtering
As
a result, we can observe the following picture: the highest sales weekend
brought goods firm 3 (Picture 3).
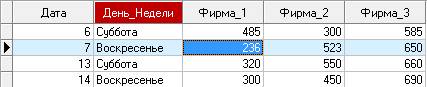
Picture
3 – The filtered data
Cube.
Cube
is one of the most common methods of complex multidimensional data analysis,
known as OLAP (On-Line Analyzing Process).
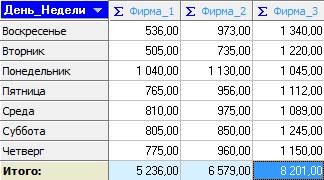
Picture
4 – Cube
The
resulting table and cube allow the analyst to conclude that the products of the
company 3 is in great demand among buyers and brings more stable income than
products firm 1 and firm 2. And even on weekends 3 products companies are in
great demand. When extending the initial data model will analyze the more
successful days of the week, months of the sale of products of different
companies and make appropriate organizational conclusions.
Literature:
1. http://www.basegroup.ru - Website data analysis technologies