Physics/molecular physics
Dr.Ph. of Technical Sciense,
Professor, Nikolaev N.S.,
сandidate of Technical Sciences, Burlev M.Ya.
Moscow
State University of Food Industry, Russia
ELECTRICAL PROPERTIES OF SKIM MILK
Application
of electric technologies to increase the efficiency of process and equipment
involves studying the electrical properties of biological objects and their
changes over time.
To this
end, experiments were performed to study the electrical resistance of the skim
milk using effective interventions – “electric impulse effects”. In the sample (skim milk
poured within a circle with d = 20 mm on a dielectric spacer) placed two
electrodes is 15 mm, distance between which amounted to 15 mm. Using these
sample electrodes was connected to a generator of signals and measured the
force of current flowing in the circuit. Knowing output voltage of the
generator and amperage in a circuit, the resistance of the object found by law
station chain to the Ohm (resistance connecting wires and signal generator neglected).
Sample with electrodes placed on the scales and the ratio between the length of the impulse to its period Q = 3, voltage U = 40 V measured the amperage (I) impulses at a frequency of f = 100, 200, 300, 400 Hertz. The results are presented in table 1-5.
Table 1
Change of the active electrical resistance (R) of the
skim milk without using electric impulse effects
|
W % |
150 |
100 |
115 |
70 |
40 |
20 |
10 |
5 |
|
I mA |
10 |
6 |
2 |
0,6 |
0,5 |
0,053 |
0,013 |
0,007 |
|
R kOm |
2 |
3,16 |
10 |
31,6 |
80 |
750 |
3000 |
6000 |
W - mass
fraction of moisture, %
I - current
strength, mA
R - active electrical resistance, kOm
Table 2
Change of full electrical resistance of skim milk at
frequency impulse f1 = 100 Hz
|
W (%) |
150 |
100 |
70 |
50 |
40 |
20 |
10 |
5 |
|
I mA |
10,5 |
6,7 |
2,6 |
2,3 |
0,8 |
0,2 |
0,01 |
0,04 |
|
Z kOm |
1,9 |
3 |
7,8 |
19 |
52 |
190 |
450 |
830 |
|
f Hz. |
100 |
100 |
100 |
100 |
100 |
100 |
100 |
100 |
Table 3
Change of full electrical
resistance of skim milk at frequency impulse f2 = 200 Hz
|
W(%) |
150 |
100 |
70 |
50 |
40 |
20 |
10 |
5 |
|
I mA |
10,5 |
7,7 |
2,7 |
3,6 |
1,6 |
0,4 |
0,1 |
0,053 |
|
Z kOm |
1,9 |
2,6 |
7,5 |
11 |
26 |
100 |
320 |
750 |
|
f Hz |
200 |
200 |
200 |
200 |
200 |
200 |
200 |
200 |
Table 4
Change of full electrical
resistance of skim milk at frequency impulse f3 = 300 Hz
|
W(%) |
150 |
100 |
70 |
50 |
40 |
20 |
10 |
5 |
|
I mA |
10,5 |
6,7 |
2,6 |
2,3 |
1,3 |
0,36 |
0,1 |
0,05 |
|
Z kOm |
1,9 |
3 |
7,8 |
19 |
31,6 |
110 |
650 |
790 |
|
f Hz |
300 |
300 |
300 |
300 |
300 |
300 |
300 |
300 |
Table 5
Change of full electrical
resistance of skim milk at frequency impulse f4 = 400 Hz
|
W(%) |
150 |
100 |
70 |
50 |
40 |
20 |
10 |
5 |
|
I mA |
10,5 |
6,7 |
2,2 |
1,6 |
0,5 |
0,15 |
0,01 |
0,04 |
|
Z kOm |
1,9 |
3 |
9 |
26 |
75 |
260 |
780 |
1000 |
|
f Hz |
400 |
400 |
400 |
400 |
400 |
400 |
400 |
400 |
By
experimental data graphs are presented in Figure 1, 2.
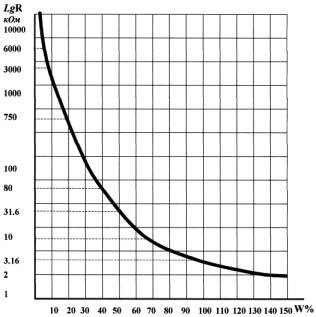
Fig. 1.
Changing the active resistance of skim milk, depending from of mass
fraction of moisture.
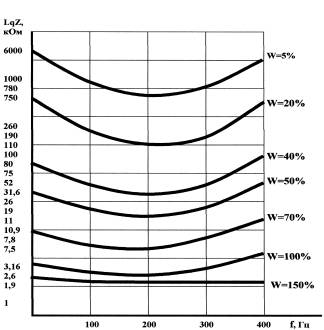
Fig. 2.
Change of full electric resistance of skim milk depending on the frequency of
the impulses when different of mass fraction of moisture.
Analysis of graphs shows that impulses at a frequency of f = 200 Hz, the
ratio between the length of the impulse to its period Q = 3, biological object (skim milk) has the least electrical resistance by
different of mass fraction of moisture.
Literature:
1.
Tepel Alfred. Chemie und Physik der Milch
/ Veb Fachbuchverlag // Leipzig. – 1979.
– Seite 474 – 480.
2.
Masters K. / Spray Drying
Handbook // George Godwin. London. Great Britain. 1985. – Pages 696 – 701.