Bateev Kazbek, Serko
Evgeniy
Second year students of
the Faculty of Accounting and Economics,
Petrova Yulia Andreevna
Senior lector, PhD in philosophy, the chair of foreign languages for graduates in Economics
Rostov
State University of Economics (RIPE)
THE COST ANALYSIS OF HOUSEHOLD CONSUMPTION FOR EDUCATION
At the present stage of development, education in the Russian Federation
has a great importance for economic growth and the quality of labor resources. Scientific and technological advances never stop and consequently, the
complexity of consumer
goods production and services increases, which causes the need to
improve the education, involving more well-educated people in these spheres.
Table
1
The dynamics of household expenses, rub. per
month per child[1]
|
Year |
Household consumption for children under the age of 16 years old: |
|||
|
One child, rub. |
Two children, rub. |
Three children, rub. |
Four or more, rub. |
|
|
2004 |
3454,3 |
2571,9 |
1782,3 |
1139,4 |
|
2005 |
4424,4 |
3332,3 |
2224,7 |
1327,2 |
|
2006 |
5136,7 |
3910,9 |
2694 |
1847,6 |
|
2007 |
6895,8 |
5159,6 |
3656,8 |
2143,3 |
|
2008 |
8064,5 |
6492,1 |
5399,7 |
3237,6 |
|
2009 |
8316,6 |
6856,3 |
5999 |
3286,6 |
|
2010 |
9249,4 |
7458,3 |
5724,5 |
2977,4 |
|
2011 |
10815 |
8972,3 |
6030,6 |
4666,1 |
|
2012 |
12326,4 |
10356,3 |
6480,9 |
3949,1 |
|
2013 |
13281,6 |
11173,1 |
9618 |
4909,1 |
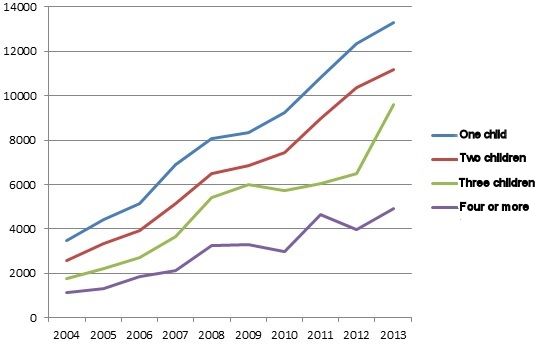
Figure 1. Diagram of the dynamics of household expenses for 1 child.
Analyzing the data of the Table 1, we
may come to the conclusion that the costs of household consumption made up 13281.6
rubles per child per month in 2013 in families with one child, which was more
than in the previous year - 955.2 rubles, or 7.75% and in comparison with 2004,
these expenses increased by 9,827.3 rubles, or 384.5%. In large families with
four or more children, the total cost per child per month in 2013 made up
4,909.1 rubles, which is more than in the previous year to 960 rubles, or
24.31%, as compared with 2004, these expenses increased by 3,769.7 rubles, or
430.8%.
In spite of growing expenditures of the Russian population
per child in 2013 in families with different number of children, statistics
shows the reduction of consumption required to the child, depending on family size.
The reduction in expenditures for a child regards not only
overall consumptions, but expenses for education.
Table 2
The
dynamics of household expenses for education, rub. per month per child[2]
|
Year |
Household consumption for children under the age of 16 years old: |
|||
|
One child, rub. |
Two children, rub. |
Three children, rub. |
Four or more, rub. |
|
|
2004 |
51,2 |
58,5 |
19,5 |
6,3 |
|
2005 |
82,7 |
59,6 |
22,3 |
6,6 |
|
2006 |
93,3 |
49,6 |
36,8 |
11,5 |
|
2007 |
115,7 |
82,2 |
44,3 |
14,5 |
|
2008 |
134,4 |
81 |
62,3 |
29,1 |
|
2009 |
151,9 |
82 |
58,6 |
17,2 |
|
2010 |
142,4 |
79,3 |
34 |
15,6 |
|
2011 |
144,5 |
156,7 |
45,5 |
36,5 |
|
2012 |
158,6 |
195,8 |
39,7 |
45,4 |
|
2013 |
167,3 |
125 |
54,4 |
34,1 |
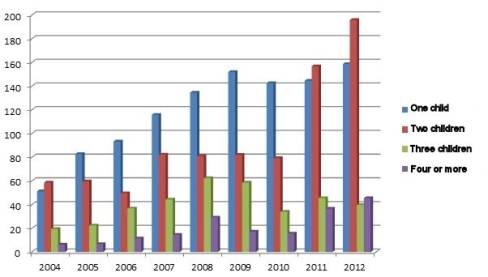
Figure 2. Diagram of the dynamics of household expenses for education
for 1 child
Analyzing the data in Table 2, we come to the conclusion that
household expenses for education per month in 2013 in family with one child
made up 167.3 rubles, which is more than in the previous year by 8.7 rubles, or
5, 49%, compared with 2004, these expenses increased by 116.1 rubles, or
326.76%. In large families with four or more children, the total cost per child
in 2013 made up 34.1 rubles, which is less compared to the previous year by
11.3 rubles, or 33.14%, compared with 2004, these expenses increased by 27.8
rubles, or 541.3%.
Using the data from the first and the second table, we can
calculate the current consumption for education from total household costs:
Intensity-of-use
coefficient =
Table 3
The share of
consumption spending out of total household for
education per child
|
Year |
Households with children under the age of 16 years, which are: |
|||
|
One child,% |
Two children, % |
Three children, % |
Four or more,% |
|
|
2004 |
1,12 |
2,27
|
1,09
|
0,55 |
|
2005 |
1,87 |
1,79
|
1,00
|
0,50 |
|
2006 |
1,82 |
1,27
|
1,37
|
0,62 |
|
2007 |
1,68 |
1,59
|
1,21
|
0,68 |
|
2008 |
1,67 |
1,25
|
1,15
|
0,90 |
|
2009 |
1,83 |
1,20
|
0,98
|
0,52 |
|
2010 |
1,54 |
1,06
|
0,59
|
0,52 |
|
2011 |
1,34 |
1,75
|
0,75
|
0,78 |
|
2012 |
1,29 |
1,89
|
0,61
|
1,15 |
|
2013 |
1,26 |
1,12
|
0,57
|
0,69 |
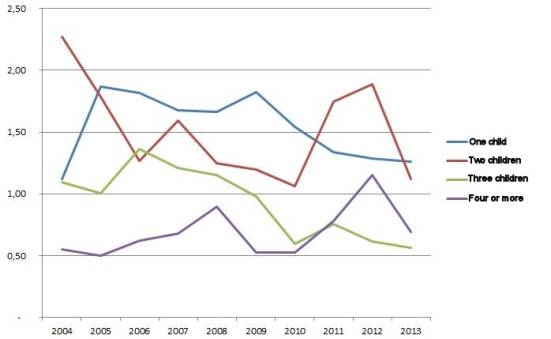
Figure 3. Diagram of changes in the share of consumption spending out of total
household for
education per child
According to the Table 3, we may calculate how the share of expenses has changed out of total household for
education per child. In families with one child in 2013, the share of costs was
1.26%, less than 0.03% compared with 2012, and in comparison with 2004, the
share of consumption spending for education increased by 0.14%. In large
families with four or more children, the share of spending for education was
0.69% in 2013, less than 0.46% compared with 2012, and in comparison with 2004,
the share of spending for education increased by 0,14%.
According to the date of the Table 3, the share of consumption
spending for education depends on the number of children in the family. But strange to say,
the more children in the family, the lower the share of consumption spending for
education.
In
the beginning of 90-s of the XX century, the Russian Federation faced a
serious demographic crisis, rapidly fell the production of goods and services,
per capita income, birth rate. The reason was that "harsh" conditions
which occurred as the consequence of the post-Soviet situation. In our article, we've looked at how the most important socio-economic indicator
has changed in the
share of consumption spending out of total household for
education per child up to 16 years old, in families with different numbers of
children. The main reason of such changes was that the government assumed a task to
increase the population not only due to migratory flows, but also due to the
natural increase. The population growth is a very important problem, but at the
same time the level of education of children may not be the less decisive. Go for quantity, not
quality, is not the best variant if we want to get highly intelligent
and educated generation. The main goal of economic development means improving the well-being of
the nation, so, now during the economic slack, it is the
best variant to invest in education of our children, for further stability and
effective improvement of
our country's wealth.
References: