Akimbekov N.Sh.1,
Heras C.O.2, Digel I.E.2, Zhubanova A.A.1
1Al-Farabi
Kazakh National University, Kazakhstan
2Aachen
University of Applied Sciences, Germany
Flow-through
column design for elimination biological liquids
Column-based experiments are of great importance since
they probably represent the most convenient and efficient way of future medical
application of the carbonized materials.
The activated carbon (AC) on the basis of rice shells was
used during the experiment. The sample was carbonized according to the
procedure developed at the Laboratory of Hybrid Technologies in the Institute
of Combustion Problems, Almaty, Kazakhstan and all experiments were done in
Biomedical Engineering laboratories of Aachen University of Applied Sciences,
Julich, Germany.
Flow-through column experiments are intended to
provide a more realistic simulation of dynamic conditions and to quantify the
movement of the desired materials relative to the packed column. The basic
experiment is completed by passing a liquid (hemoglobin, BSA (bovine serum
albumin) and LPS (lipopolysaccharide) with certain concentration of the
material of interest through a column packed with activated carbon. The design
of the experiment was complicated due to the intrinsic characteristics of the
Activated carbon. Its fragility during handling made it difficult to pack into
the column, and different attempts were done, however, it was necessary to
avoid any kind of air bubble interface in the packed column, as it would again
interfere with the procedure. This was rather difficult to archive, the first
attempts were full of air bubbles, as the column used was open in the middle in
an attempt to introduce the material without having to crush it, or damage it
unnecessarily, as it was stated before, if the material was crushed, dust
contents are liberated and the overall performance of the experiment is
reduced, furthermore, the experiment can’t be repeated in the same
conditions.
For the column design a Serologische Rotilabo®-
Einmalspritzen (50 mL) from Carl Roth GmbH, the design was
consistent with the amount of activated carbon planned for this experiment. The
only disadvantage is the fragility of the syringe, as it can be easily broken.
Also the diameter from the inlet was 3.5 mm, since the medium size of activated
carbon particle is 1 mm x 4 mm, the first attempt was done cutting the syringe
by a half, the inner diameter of 2 centimeters allowed an easier filling of the
syringe, however air bubbles were introduced between the activated carbon and
the walls of the syringe, moreover, some liquid was drop once both sides were
sealed together.
The amount of activated carbon per column had some
variations from column to column, since the process was at some point random
filling, each of the particles occupied a site in the column, and the form of
the activated carbon is not regular.
The amounts of carbon variation was low with a
standard deviation of 0.06 g and an average of 10,9 g.
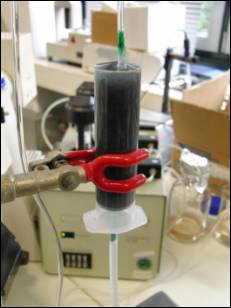
Figure 1. Column experiment setup
The syringe volume was 30 см3, with a standard deviation of 1 mL, again, the
volume of liquid obtained after each experiment was variable because it depends
on the amount of activated carbon introduced into the column. The values were
obtained after the experiment was done. In order to obtain the adsorbed amount,
the column was opened and the solution was decanted overnight with its amount
measured afterwards. As the activated carbon possesses a huge surface area and
it’s pore network is capable of trapping water molecules, to measure the weight
it was necessary to dry the Activated Carbon afterwards. The columns were cut
by half and the AC taken out. They were dried for 3 hours at 255 °C. Since the
activated carbon was not going to be used again for this experimental setup, the
temperature and time was not an important variable since the reactivation of
the carbon was not part of this study.
The experimental setup for the column was done. The
time points used during the hemoglobin, BSA and LPS measurements were
established at one measurement each 10 min, from 0 to 240 minutes. The concentrations used for all the
adsorbates correspond to the ones, since the column experiment can give some
information about the dynamics of the activated carbon, Breakthrough curves are
used to find those values. The column was connected to the pump and the d![]() was
replaced with PBS (pH 7.4, 280 milliosmole), 200 mL of PBS were introduced to
the column with a rate of 100 mL/h, by doing that, the experiment was started
knowing that there was only PBS as filling volume in the column. The stock
solution was in the meantime already prepared in the pump, so once it started
the solution was directly in contact to the Activated Carbon in the column.
was
replaced with PBS (pH 7.4, 280 milliosmole), 200 mL of PBS were introduced to
the column with a rate of 100 mL/h, by doing that, the experiment was started
knowing that there was only PBS as filling volume in the column. The stock
solution was in the meantime already prepared in the pump, so once it started
the solution was directly in contact to the Activated Carbon in the column.
At t=0 the pump was injecting the solution into the
column. After 10 minutes the first measurement was taken, with a mean volume of
22.45 mL per column, it was expected that in 15 minutes the whole volume of the
column was replaced by the stock solution and therefore the adsorption process
was in motion. By taking the first value before that threshold was archived,
some information could be obtained regarding the dynamics of adsorption.
Theoretically the curves obtained from such experimental setup correspond to
the following figure:
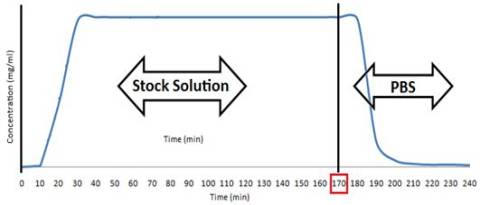
Figure 2. Solution exchange in the column experiment
At time t=170, the solution was changed, stock
solution (with the corresponding concentration for each experiment) was changed
with PBS buffer (pH 7.4, 280 milliosmole), as it’s shown in the figure, the
purpose of this exchange in the solutions was to find out how was the material
reducing the concentration of the solute, if it was because there was an
adsorption process going on and the material was therefore removed either by
either relatively irreversible physisorption
or chemisorption, or it was just working as a chromatographic column, which of
course would, after some time (presumably the one that takes for the contents
of the solution to be exchanged completely, or 15 minutes) give us an increase
or peak in the concentration on the output of the column. This would be shown
after the t=170 in the graph.
Also, this approach would
give information on the rate of sorption for the last part of the experiment,
as again there will be a progressive dilution in the solution that would arouse
a change in the shape of the curve and a negative slope. For the activated
carbon to work as adsorbate there should be a concentration reduction that
would appear as a decrement in plateau part of the graphic compared to the
initial concentration, the rate of adsorption depends on how that reduction was
observed and how big was it. This is important since a column experiment is an
open circuit experiment in the sense that the solution flows through the column
with a certain velocity, depending on the properties of the activated carbon is
how the uptake of solute is going to take place and if it remains there once
solution is changed. Otherwise there would be a point at which the out coming
solution would show an increment in the concentration.
References:
1.
Endotoxin removal from protein
solutions. Dagmar Petsch, Friedrich Birger
Anspach. s.l. : Journal of Biotechnology,
2000, Vol. 76, pp. 97–119.
2.
Bacterial LPS: a mediator of
inflammation. Pabst M. J., Johnston R. B. Amsterdam : Handbook of inflammation, 1989, Vol. 6.
3.
Tushev, Georgi. Carbonized Materials for Lipopolysaccharides Removal. Juelich :
Lab Cell-Biophysics, Lab Medical and Molecular Biology.