prof.A.Drobyshev,
A.Aldiyarov,D.Maussymbayev, A.Timchenko, A.Shinbayeva
Al – Farabi Kazakh
National University, Almaty, Kazakhstan.
Research processes of
formation and properties of clusters of methane in water cryomatrix.
1.Abstract
Nowadays natural gas hydrates attract
special attention as a possible source of fossil fuel. According to various
estimates, the reserves of hydrocarbons in hydrates considerably exceed
explored reserves of natural gas. Due to the clathrate structure the unit
volume of the gas hydrate can contain up to 160-180volumes of pure gas. In
recent years interest to a problem of gas hydrates considerably has increased.
It is connected with the progress of searches of alternative sources of
hydrocarbonic raw materials in countries that do not possess the resources of
energy carriers. Thus gas hydrates are nonconventional sources of the
hydrocarbonic raw materials which can be developed next years.
At the same time, there was not full understanding of mechanisms of
formational clathrates of methane hydrates, their thermophysical and mechanical
properties were investigated low[1]. Regarding this experimental modeling of
the processes of formational clathrate hydrates of methane in water cryomatrix
in the process of co-condensation from gas phase on cooled substrate in the range of condensation temperatures
T=(12-60)K and pressures P=(10-4-10-6) Torr.
Concentration of methane in water varied in the range of 1-10%. The thickness
of a film was 30-60 mcm. The vibrational spectra of two-component thin films of
cryovacuum condensates of CH4+H2O were measured and
analyzed.
2.Experiments
and measurement procedure
At the core of procedure for obtaining
information about the state of methane molecules in the matrix of different
gases is an analysis of the absorptive amplitude of band, which corresponds to
the vibrations of the methane molecule in the unbounded state. The measurements
were performed at the system, which scheme is given in Fig.1. The main unit of
the system is a cylindrical vacuum chamber (1) in diameter and a height of 450
mm. Pumping out the vacuum chamber was carried out by turbo-molecular pump
Turbo-V-301 (2), which was connected to the chamber through the sliding vane
gate valve CFF-100 (3). As a
backing vacuum pump was used dry spiral pump SH-110 (not shown at the picture).
The ultimate vacuum in the chamber reaches the value not worse than Р=10-8Torr.
Measuring the pressure in the chamber was carried out with wide-range pressure
transducer FRG-700 (4) with the controller AGC-100.
In the center of the chamber is located
microcryogenic system of Gifford-McMahon (5), on the top flange of which is
mounted mirror substrate (6), serving as condensation surface of mixture of
nitrogen and water. The substrate is made from copper, the working surface of
which is covered with silver. The diameter of the substrate is d=60 mm. The
minimum temperature of condensation is Т=12К. The temperature measurement was
carried out by silicon sensor TS 670-1.4 using a temperature
controllerМ335/20с. Measurement of thickness and rate of condensation is
carried out by a double-beam laser interferometer based on photo-electron-multiplier
P25a-SS-0-100 (7). IR absorption spectra were measured in the frequency range
400 cm-1 – 4200 cm-1.
To obtain a mixture of the test substance
with a matrix gas was used calibrated volume (not shown at the picture). At
first the scope was filled with the investigated gas (methane) up to necessary
pressure. Typically, the pressure value was 1-1,5Тоrr. Thereafter, the
calibration volume was filled with water vapor up to the required pressure,
which corresponds to a working concentration. For the preparation of mixture
was used pressure controller PR 4000 (MKS) with an accuracy of measurement of
pressure 0,01Torr.
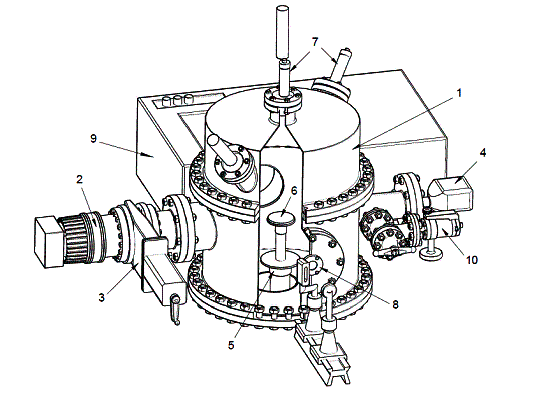
Fig.
1- Experimental installation. 1- vacuum chamber; 2- pump Turbo-V-301, 3-
sliding vane gate valve CFF-100; 4-
pressure transducer FRG-700; 5-
microcryogenic system of Gifford-McMahon;
6- substrate; 7-
photomultiplier; 8-optical channel; 9-IR-spectrometr; 10-lake system
There is a following procedure for the
performance of the experiment. The vacuum chamber was pumped out up to a pressure
of Р=10-8Torr, then to prevent contamination the substrate was
overlapping with the protective plate and carried out its cooling up to Т-12 К.
With the leakage system (10) in the chamber was setting the operating pressure
of the mixture Р=10-5 Torr, the substrate was opening and begun the
process of film cryocondensation, controlled by double-beam laser
interferometer. Upon reaching the sample thickness of about 25-30 μm gas
filling was stopped and a pressure about Р=10-8Torr was placed back
in the chamber. Next, the vibrational spectrum of the sample was measured,
whereupon IR spectrometer was installed at a frequency of observation and
within 30-40 minutes was measured interferometer signal at a constant
temperature equal to the condensation temperature Т=16 К. Thus, the state of
the sample was analyzed over time at a constant temperature.
Further measurements were carried out by
two methods. In one case, was carried out the step heating of the sample by
0.5-1 degree with the measurement of the reflectance spectrum at a fixed
temperature. In the second case, was carried out the continuous heating of the
sample, the speed of which determined by the natural heat inflows to the
substrate with switched off microcryogenic machine. In this case, was measured
the IR-spectrometer signal at a fixed frequency in the vicinity of the
characteristic vibration frequencies of the water molecule. Changes in a given
signal are a reflection of transformations in the test sample.
3.Conclusions
Our studies have shown that in the process of co-condensation of methane and
water on the substrate at a temperature of T = 16 K, a two-component solid film
is formed. Measuring the vibrational spectra of the samples we have found a
little "blue" shift relative to the spectra of pure solid methane,
amounting to the value of the bending vibration of about 14 cm-1 for
CH stretching vibrations of approximately 5 cm-1. It is virtually
identical to the data for nitrogen and argon matrices, from which we can
conclude that the state of the methane molecule and its vibrational spectrum
are weakly dependent on the composition in the discussed mixtures.
At this stage of research we can make some assumptions regarding the status of
methane molecules in the "matrix" of water based on the comparison of
the thermal desorption curves and of thermograms of amplitude variations of the
absorption characteristic vibration frequencies of methane.In our view, it is
natural to assume that under these conditions cryoprecipitated methane in solid
solution with water can occure in three states. Firstly, it is actually a
condensed state, i.e. solid phase of methane. Secondly, the methane can be in
an adsorbed state. The role of absorbent is played by the amorphous solid water
(ASW). Those states are condition characteristics of water cryovacuum
condensates formed at T = 16 K [14, 15]. Thirdly, methane may be in a bound
state with the molecules of water forming clathrates. This, indeed, is the
subject of our study. In this paper we attempt to determine the temperature
ranges of these states, based on the properties of amorphous solid water ASW
and comparing obtained thermograms desorption and absorption amplitudes of
deformation vibrations of methane.
A. Drobyshev, A. Aldiyarov, K. Katpaeva, E. Korshikov, V. Kurnosov, D. Sokolov. 39 (8),
2. A. Aldiyarov, A. Drobyshev, E. Korshikov, V.
Kurnosov, and D. Sokolov. Physics of the Solid
State, Vol. 54, No. 7, pp. 1475–1479
(2012)
3.
P.
Jenniskens, D. F. Blake. Astrophys. Jour. 473,
1104-1113 (1996)
4. A. Aldiyarov, M. Aryutkina, A. Drobyshev, M. Kaikanov, and V. Kurnosov.. Low Temp. Phys, Volume: 35, Issue: 4, Pages: 251-255 (2009)
5. Talon C., Ramos M., Vieira S., Guello G.,
Bermejo F., Griado A., Senent M., Bennington S., Fischer H.,Schober H.
Low-temperature specific heat and glassy dynamics of a polymorphic molecular
solid // Physical Review. – 1998. – vol. 58,
2. – p. 745.
6. M.E. Fajardo and S. Tam., J. Chem. Phys. 115, 6807 (2001).
7. A.J. Tursi and E.R. Nixon, J. Chem. Phys.52, 1521 (1970).
8.
J.B. Paul, C.P. Collier, R.J.
Saykally, J.J. Sherer, and A.O. Keefe, J. Phys. Chem. 101, 5211 (1997).