![]() * Aldibekova A. N.** Voronin A. M.
* Aldibekova A. N.** Voronin A. M.
*
Kazakh National Technical University named after K. Satpayev,
Kazakhstan
**
Almaty Technological
University, Kazakhstan
Non-contact measurement of fluid flow by nuclear magnetic resonance
Nuclear
magnetic resonance (NMR) is a
resonant absorption of radiofrequency and electromagnetic energy by a substance
with nonzero magnetic moment of nuclei located in an external constant magnetic
field. A nonzero nuclear magnetic moment has the nucleus 1H, 2H, 13C, 14N, 15N, 19F, 29Si, 31P and etc. Usually NMR is a uniform magnetic field В0, on which there is superimposed a weak radio frequency field В1 perpendicular to the field В0. For substances for which the nuclear spin I = ½ (1H, 13C, 15N, 19F, 29Si, 31P and etc.) there are two possible orientations of the
magnetic dipole moment of the nucleus ![]() in the field В0: "in the field" and "against the
field". Appeared two energy levels E due to the
interaction of the magnetic moment of the nucleus with the field В0 are separated by the interval
in the field В0: "in the field" and "against the
field". Appeared two energy levels E due to the
interaction of the magnetic moment of the nucleus with the field В0 are separated by the interval![]() . Upon condition that
. Upon condition that![]() , or
, or ![]() , where h – Planck's constant,
, where h – Planck's constant, ![]() – frequency of the radiofrequency field В1,
– frequency of the radiofrequency field В1, ![]() – angular frequency,
– angular frequency, ![]() the so-called gyromagnetic ratio of the nucleus , there is resonant
absorption of energy of fields B1, called NMR [1]. For
nuclides 1H, 13C, 31P NMR frequency in the field В0=11,7 T are equal, respectively, to (MHz): 500,
160,42 and 202,4; values
the so-called gyromagnetic ratio of the nucleus , there is resonant
absorption of energy of fields B1, called NMR [1]. For
nuclides 1H, 13C, 31P NMR frequency in the field В0=11,7 T are equal, respectively, to (MHz): 500,
160,42 and 202,4; values ![]() (in
MHz/T): 42.58, 10.68 and 17.24. According to quantum model in the field В0 there are arise
energy levels 2I + 1 between
which the transitions are allowed when
(in
MHz/T): 42.58, 10.68 and 17.24. According to quantum model in the field В0 there are arise
energy levels 2I + 1 between
which the transitions are allowed when![]() , where m – the magnetic quantum number.
, where m – the magnetic quantum number.
NMR is the base for the phenomenon of NMR spectroscopy. NMR spectra were recorded by the using of radio spectrometers.
The main elements of NMR-analyzers
and flow meters are magnets for generating the primary resonance field. The quality of magnets and magnetic fields in the homogeneity of the magnet gap has high demands. The relative homogeneity of the field in the work area
must be 10-6 до 10-10.
As it was already noted, the
method of signal observing of free
nuclear induction in the earth's
magnetic field В0 implies the polarization of the nuclear
spins by the additional magnetic
field В1 (B1
![]() B0 ,
B0 , ![]() ), which is turned off during the
measurement and followed by the activation of spin by the radiofrequency field В1 (900
impulse).
), which is turned off during the
measurement and followed by the activation of spin by the radiofrequency field В1 (900
impulse).
The
signal from the free nuclear induction (i.e. the absorption signal)
is given by the formula:
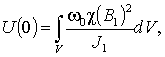
where J1 – electric current flowing through the polarizing coil, V – the volume of the
sample, χ – magnetic susceptibility.
If the
installation uses the frame type coils [2] and the fluid
moves on both sides of the
flat sensor, the total free nuclear
induction signal will
have the form (see Fig. 1) ![]() ,
,
where ![]() . Consequently,
at the nuclear envelope
of the free induction signal there are oscillations
of the type
. Consequently,
at the nuclear envelope
of the free induction signal there are oscillations
of the type ![]() In this case b is the distance between the centers of successively
located coils in the flat sensor.
At first sight it may seem that the unilateral and bilateral flow of the sensor
differ from each other by the extremely change
of the fill factor. However, experiments
clearly show the validity of the above mentioned equations.
In this case b is the distance between the centers of successively
located coils in the flat sensor.
At first sight it may seem that the unilateral and bilateral flow of the sensor
differ from each other by the extremely change
of the fill factor. However, experiments
clearly show the validity of the above mentioned equations.
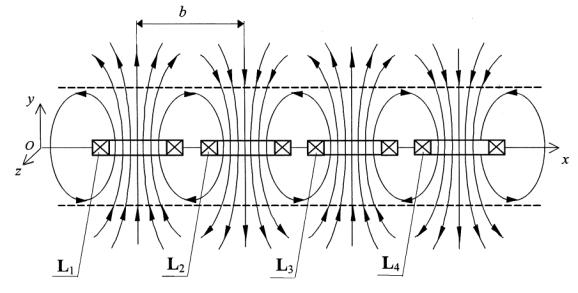
Fig. 1. Bilateral NMR sensor.
In the experiments,
water is used as the sample liquid. The free nuclear induction signal is
observed on protons in a uniform geomagnetic field. For induction of this the
magnetic field (50 mT) the resonant frequency has the quantity
of the order of 2 kHz. This value is used to account the influence of
variations in the geomagnetic field on the results of experiments.
During the work [3] it
is proposed to use nuclear magnetic resonance sensors of various types, as the
converter of fluid velocity in frequency. The ratio between the period P and the geometry of the sensor is
shown in Table 1. Here P is the repetition period of the distribution of the
initial phases.
Analytical equation for the kinematic shear can be written as ![]() , if the frequency is measured in
Hz this equation will be
, if the frequency is measured in
Hz this equation will be![]() .
.
Table 1.
Dependence of the
kinematic shift of the frequency
of the free nuclear signal from
the induction on the geometry of the
sensors
|
Type of the sensor |
Kinematic shift |
repetition period Р |
|
Toroid |
v/R |
2πR |
|
NMR-ring |
|
|
|
Flat |
|
2b |
Below there is described the circuitry of the measuring system, developed
on the basis of NMR - pulse setting,
namely – transmitters and receivers of signals from the coils disposed in the
working area of the magnet.
The base of the reception
and transmission block is a matching device (MD), which is presented as one or
more inductive coils, inside of which there are placed the objects of study
(Fig. 2). The hardware of the block can be adapted to the resonant frequency of
virtually any substance placed in a test tube, by the changing the operating
frequency of all the nodes of the block. For the formation of all possible
frequencies in the system there is used one reference oscillator of 10 MHz. For
the synthesis of reference frequency synthesizers there are used DDS (Direct
Digital Synthesis) of the company Analog Devices in the block. To generate a
signal in the range of tenths of hertz to 100 MHz and more to the DDS device
there is a need to use only a clock source, the stability of which determines
the stability of all the frequencies generated by the synthesizer.
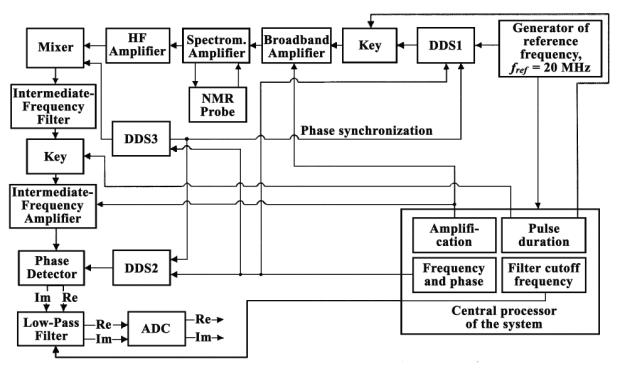
Fig. 2. Block diagram of the reception
and transmission block
In synthesizers there is
provided a possibility of synchronized operation of multiple DDS chips from one
clock source, which is a basic requirement for working with NMR signals.
The value of the
synthesized frequencies is set by the CPU system. The transmitting part of the
device, in addition to direct digital synthesis synthesizer, contains a key
that generates a short impulse filled by the frequency of synthesizer, and a
broadband power amplifier of short impulse (BPA). The aim of BPA - to amplify
the synthesizer signal of the transmitter DDS1 without distorting the impulse
in a wide frequency range from a few to 100 MHz. The transmitting pulse
duration, its leading and trailing edges are controlled from a central
processor.
The work of three
frequency synthesizers are synchronized between each other exactly up to a
phase, that give the possibility to get rid of the combination of interference.
The receiver is made
under the scheme of super heterodyne with the single frequency conversion.
The capacity of the
first mixer is presented by the intermediate frequency filter (IFF). It is a
fourth-order filter, the main task of which is the selection of the desired
signal of intermediate frequency (IF) from the interference and products of
conversion mixer.
After the IFF there is
the key, the same to the key in the transmission path, but which performs the
opposite effect: when the key of the transmitter is opened, the key of the
receiver is closed and do not allow transmitting a powerful impulse to the
amplifier input. When the pulse the transmitter key is opened and the entire
signal of the "echo" of the test substance is applied to further
processing.
Then the highlighted
useful signal is amplified in the intermediate frequency amplifier (IFA). Due
to the quartz filter IFF it is possible to get rid from contour coils in IFA and to apply for amplifier ща BA chip with digital amplifying control that allowed obtaining on the output
of the intermediate frequency amplifier the undistorted impulse of the
"echo" of the NMR signal.
For the formation of the
spectrum using the Fourier-transforming there is needed the real and imaginary
parts of the signal. For their allocation there is used a phase detector (PhD)
with the reference frequency, four times more than the inverter. Both parts of
the phase detector signal passes through a low frequency filter ( LFF ) with an
adjustable bandwidth and are read using a 16-bit ADC of the successive
approximation to the central processor,
which sends the digitized two-channel signal to a personal computer with
installed software.
The structure of
stabilization block of the field is identical to the structure of the reception
- transmission block, except the moment, when the signal from the phase
detector goes to the control device of the spectrometer magnetic field.
The architecture of the
universal transceiver block allows controlling from the CPU of a big amount of
devices which support two-wire interface. In each block of reception and
transmission there are used multiple microcontrollers. Another controller is
used to control the ADC and to receive digital data from it.
The connection with PC
via USB is made using special chip – adapter USB-UART of the company FTDI. This
chip is a highly integrated USB-COM adapter which allows organizing a serial
data exchange between the external device on the microcontroller and the PC via
the USB using a minimum of external components (connector and passive
components).
Typically, the density
of probability of the fluid flow is called distribution, which is used to
visualize the Fourier-transform of NMR signal as a function of qv. Normally,
only one component of qv is changed, distribution spreads depending on the
displacement at a predetermined time interval and do not depend on the speed.
This is used to diffuse movement.
The velocity
distribution is most easily measured with a pulsating gradient field with a
pair of impulses of antiphase gradient field, while the associated echo
amplitude is recorded as a function of the amplitude of the gradient.
Such experiment can be
carried out with the time-constant gradient fields by changing the echo time tЭ to the echo experiment.
The velocity profile for
laminar flow through a pipe of circular
cross section is parabolic (Figure 3).
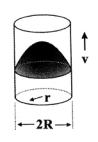
Fig. 3. Laminar
flow in a pipe of circular cross section
The speed distribution can be obtained by equating the probability density ![]() of finding the velocity components between v and v +
dv to the circle area with the radius r with the increment dr, where these
components have been found.
of finding the velocity components between v and v +
dv to the circle area with the radius r with the increment dr, where these
components have been found.
This distribution is constant
for all speeds, it is close to
zero near the pipe wall, close to ![]() in the center and is zero elsewhere, and
such distribution has the type of
a parabola function.
in the center and is zero elsewhere, and
such distribution has the type of
a parabola function.
From
the theory it is seen, that ![]()
![]() .
.
The velocity distribution is very
sensitive to even small flaws
in the experimental system, it is better seen the process outputs than the images of speed velocities.
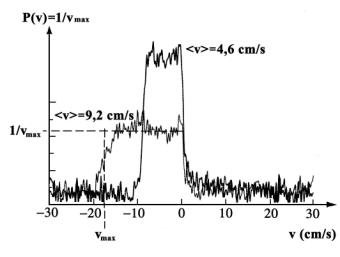
Fig. 4. Experimental data of laminar
flow. The data were obtained at
constant in time and space gradient
fields.
The above approach can be used to
create automated systems for monitoring production
processes in various work cycles [4, 5].
References
1. Блюмих Б. Основы ЯМР. М: Техносфера , 2007. – 160 с.
2. Бородин П. М., Вечерухин
Н. М. Релаксометр ЯМР в земном поле. //Научное приборостроение, 1998. Т. 8, №
1-2. С. 51-55.
3. Вечерухин Н. М.,
Мельников А. В. Датчики ядерного магнитного резонанса как преобразователи
скорости движения жидкости в частоту. //Научное приборостроение, 2007, том 17,
№ 2. С. 39-47.
4. Неронов Ю. И., Иванов В.
К. Разработка мини-ЯМР-томографа для учебных и научно-исследовательских целей.
//Научное приборостроение, 2006, том 16, № 2.
5. Voronin A. M., Aldibekova A.
N. Application of NMR in technological processes of dairy production. //Вестник Национальной
инженерной академии Республики Казахстан, 2013, № 4(50). С. 106-112.