Tadeusz
MARCINKOWSKI; Wojciech SŁOMKA
Wroclaw University off Technology
Institute of Environment Protection Engineering
ANALYSIS OF EFFECTS OF INDUSTRIAL WASTE LANDFILL
ON SUBSURFACE WATER
INTRODUCTION
Vehicles scrap, metal scrap, as well
as used home and industrial electric and electronic equipment, are waste that
contain hazardous components, such as heavy metals, oil products, etc.[1].
In case of inappropriate or
erroneous dealing with such waste, they may endanger human life and health or
the environment. Recovery and recycling of raw materials from waste is on the
one hand a challenge for our civilization, and on the other hand a legal
requirement [2,3,4].
During recovery of raw materials
from these groups of waste a significant mass of byproducts is created (waste
from waste processing), the quantity of which – in case of the neutralization
plant analyzed here – may reach as much as 30% of initial mass subjected to
processing. This quantity includes a considerable portion that is not suitable
for management and can only be disposed on a landfill.
Neutralization plant is located in
south-west region of Poland and has the own industrial waste
landfill that is being monitored since its launching in the year 2001. Monitoring
refers to the quality of piezometric water in the vicinity of the plant.
The obligation of monitoring of
landfills results, among other things, from the legislation of the European
Union that – with the aim of environmental protection as a whole, and
protection of human health in particular – requires avoiding high
concentrations of hazardous pollutants in subsurface water, reducing them or
preventing their formation [5].
Our research was directed to aspects
of safe depositing industrial waste as well as the quality of subsurface water
in the vicinity of the landfill.
ACTIVITY OF
THE SCRAP MATERIAL PROCESSING PLANT
The scrap processing plant presented
here is one of the biggest in the country. Apart from purchasing metal scrap,
the plant deals with conversion of used household equipment and auto hulks and
other large-size waste, and for two years also of used electric and electronic
equipment.
Productive activity of the plant is
based on the processing line presented schematically on Figure 1. The main
element of the line are high-duty rippers crushing scrap and a technological
process, in which crushed waste is subjected to sorting and segregation into
particular morphological fractions. Some fractions are marked out to
reutilization (ferrous and non-ferrous metals and separated so-called
alternative fuel). The remainder, in shape of the finest fraction, sorted on a
sieve of 15 mm mesh, as well as other unmarketable
waste, are transferred to deposition on own landfill located in the southern
area of the plant (Figure 2).
Figure 1. Processing line for scrap disintegrating.
Description:
1 – ripper-crusher,
7 – non-ferrous metals separator,
4 – rotary sieve, 10 – container
for flammable waste,
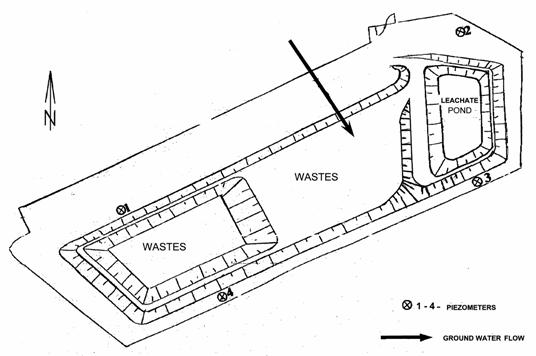
Figure 2. The landfill of industrial waste.
In order to determine the
environmental effect of deposited waste, a preliminary analyses of the
physicochemical composition of raw waste as well as of water extract of this
waste were performed [6]. Results of this research are summarized in Tables 1
and 2.
Table 1. Physicochemical
composition of the fine fraction of waste [6].
|
No.
|
Parameter
|
Unit
|
Trial 1
|
Trial 2
|
|
1
|
pH
|
|
7,5
|
7,5
|
|
2
|
Moisture content
|
%
|
13,93
|
9,03
|
|
3
|
Organic mass
|
%
|
11,43
|
16,47
|
|
4
|
Ammonia nitrogen
|
mg NNH4/kg d.m.
|
90,74
|
74,92
|
|
5
|
Organic nitrogen
|
mg Norg/kg d.m.
|
61,13
|
2140,64
|
|
6
|
Overall nitrogen
|
mg Nog/kg d.m.
|
151,87
|
2215,56
|
|
7
|
Acid-insoluble
substances (SiO2)
|
% d.m.
|
28,17
|
24,64
|
|
8
|
Calcium
|
mg Ca/kg d.m.
|
21085,92
|
20644,91
|
|
9
|
Chromium
|
mg Cr/kg d.m.
|
484,625
|
436,099
|
|
10
|
Zinc
|
mg Zn/kg d.m.
|
27499,56
|
27546,20
|
|
11
|
Cadmium
|
mg Cd/kg d.m.
|
121,244
|
132,127
|
|
12
|
Nickel
|
mg Ni/kg d.m.
|
510,455
|
170,075
|
|
13
|
Iron
|
mg Fe/kg d.m.
|
273502,0
|
303775,1
|
The analysis of physicochemical
composition of fine fraction of waste from tests 1 and 2 showed high content of zinc, iron and calcium.
Elution tests of these metals, both
for trial 1 and trial 2 (Table 2), demonstrated low solubility in water, that is a result of their metallic
form..
Water extracts of waste deposited on
the landfill were made four times later, in different periods (Table 2). They
showed slightly increased pH, quite low value of specific electrolytic
conductivity, as well as low content of nitrogen compounds. Despite of high
content of metallic forms of metals (that occur in that form in solid samples
due to their origin), they do not produce a significant environmental hazard. Table
2 also shows a beneficial effect of alkalization (with hydrated lime in a dose
of 2.5%) on intensivity of elution of metal compounds from waste.
The
examination of environmental effects of deposited waste was performed on the ground
of cyclic observation of changes in subsurface water quality in the vicinity of
the landfill.
In
order to do that, four piezometric drawholes were made to the depth of the
first water table (about 5-6 m under the ground surface level).
The direction of groundwater flow was determined as being from north-east
towards south-west. On account of dense industrial building on the northern
side, piezometers were localized in the immediate vicinity of the landfill
(Figure 2).
Piezometers
P1 i P2 were designed to observation of the quality of water flowing into the
landfill. Comparing the quality of water in piezometers P3 and P4 to the
quality in piezometers P1 and P2, effects of deposited waste on water
environment were analyzed. In addition, changes in composition of eluates were
observed. Samples of eluate were taken from the pond located in western part of
the landfill (Figure 2). Eluates flow down to the pond through the system of
drain pipes [8].
For
analysis of changes in subsurface water an overall observation of the landfill
parameters, as well as of the manner of waste and eluates management were
helpful.
Piezometric
water was collected with small pumping set equipped with two submerged
rotodynamic pumps having efficiency of 5 dm3/min and elevation
head of 10 m. Before taking samples, purifying
pumping of piezometric drawholes was performed, drawing out about triple volume
of stagnating water from each drawhole.
The
ground of decision about sampling was a stability of specific electrolytic
conductivity and pH, measured during clarification of drawholes.
The
following parameters were determined in samples of water: pH, specific
electrolytic conductivity, nitrogen compounds, CODCr and metals (Zn,
Cr, Ni, Hg).
Determination
of parameters was performed according to the reference methodologies [7].
Figure 3. Changes in subsurface water quality during
control observations – general indices.
Figure
5. Changes in subsurface water quality
during control observations – metals.
Expected and logical progress of
plots of analyzed contaminants concentrations is presented for specific
electrolytical conductivity and COD. The correlation between these parameters
can be easily found (Figure 3). Values of COD and conductivity in water flowing
to the landfill (piezometers P1 and P2) are
lower than in water flowing out from the landfill (piezometers P3 and P4).
However, this is not a situation observed during the whole period of research,
nor for all contaminants analyzed.
In some cases water from piezometer
P2 had the highest or very high values, e.g. for CODCr. Observation
of the landfill during sampling was helpful in interpretation of such a state. It
was found that after heavy precipitations leaks occur through the embankment of
the landfill from the pond of drain – on its western side (Figure 2). A portion
of this water penetrates into the drain pond, but it does not affect
concentrations of contaminants in the pond. It was also observed that a
significant portion of leaks found its way out along the access road to the
landfill quarter, according to the slope of terrain, to the vicinity of
piezometer P2. Soaking in the ground, these leaks cause contamination of water
in this piezometer. Therefore piezometer P2 should be excluded from
interpretation of measurement results untill the western enbankment would be
sealed and subsurface water in the vicinity of this piezometer would purify spontaneously.
Instances of high or the highest
values of contaminants concentration (e.g. mercury) were also found in
piezometer P1. It proves that some more contaminated water flows into the
landfill, causing increased contaminants content in piezometers P3 and P4.
Influence of waste on subsurface
water should be interpreted on the ground of correlation between concentrations
of contaminants in eluates from the pond and in water from piezometers located
in the vicinity of the outlet from the landfill (P3 and P4). Such a situation
in water quality can be observed in case of CODCr and specific
electrolytic conductivity. It is
additionally confirmed by similar tendency in changes of contamination of water
from these piezometers and in drains from the pond.
In general evaluation of changes in
contamination during the period of observation only small effect of the landfill
on water environment was observed.
Observation of tendencies in changes
of contaminants concentration during the last year of research demonstrated the
increase of subsurface water contamination with nickel and organic compounds
(CODCr), as well as the increase of salinity, measured as the
specific electrolytic conductivity.
Concentrations of examined
contaminants in subsurface waters (Figures 3 and 4) are lower or comparable to
these in water extracts from raw waste (Table 2), what confirms rather slight
influence of waste on subsurface water quality in the area of the landfill.
SUMMARY
Preliminary examination of raw
waste, observation of changes in contaminant concentration in subsurface water,
as well as observation of practices employed in landfill exploitation and
waste/eluates management, taken altogether into consideration, create ground
for proper interpretation of influence of waste on the water environment.
CONCLUSIONS
1. Waste that comes into existence
should be utilized to the highest possible degree, therefore minimizing the
surface area and volume of the landfill, as well as minimizing its
environmental impact (total load of contaminants and diversity of their
indices).
2. Post-production remainders should be
deposited in the quarter of landfill and not be used directly in construction
of embankments and ground levelling. Such materials do not thicken properly and
are evidently leaky. They can also be a direct cause of subsurface water
contamination.
3. Enbankments of the landfill should
be sealed and the drainage of eluents made passable. This will enable to avoid
influence of leaks on subsurface waters.
4. Careful choice of location of
monitoring piezometers will enable to create actual view of contamination
background and explicit interpretation of changes and influence of waste on the
environment.
References: