SIMULTANEOUS CONVERSION OF
MEASUREMENT RESULTS
FROM VOLTAGE AND FREQUENCY CHANNELS
Dariusz
Świsulski
Faculty
of Electrical and Control Engineering,
1.
Introduction
Modern
measurement systems use multi-parametric measurements, where the results are
obtained from many measurement channels. If the relations between the recorded
quantities are defined then during measuring of the quickly fluctuating
quantities simultaneous sampling is required.
Measurement
channels with conversion of the measured quantity into voltage (or current) are
used most commonly. This voltage in the process of sampling and quantifying
using an analogue-digital converter is converter to a digital form and then
stored in the memory.
a)
b)
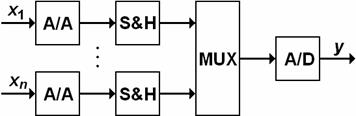
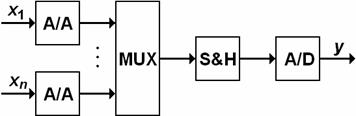
Fig. 1. Example of configuration of acquisition
module for voltage measurement signals: A/A – signal conditioner, S&H –
sample & hold, MUX – multiplexer,
A/D – analogue-digital converter
Most
of the available acquisition have only one common S&H system behind the
channel multiplexer (fig. 1a). This solution enables only sequential
sampling in consecutive channels which causes the results to be gathered in
different points of time. This makes it impossible to define relations between
the signals in different channels [1].
If
simultaneous sampling in different channels is required, each channel should be
provided with individual S&H module, placed before the channel multiplexer
(fig. 1b). The acquisition modules with simultaneous sampling are offered
by various producers, but their price is higher.
Sometimes
pulse frequency modulated signals are used as the intermediate signals in the
measurement circuit [2, 3]. Pulse signal as an intermediate signal is used
often because of a simple way of converting it to digital form and low
susceptibility to disturbance e.g. when sent over long distance.
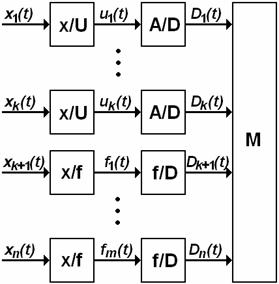
Fig.
2. Measurement system with integrated voltage and frequency channels:
x/U - measured quantity-voltage converter, x/f - measured quantity-frequency
converter, A/D - analogue-digital converter, f/D - frequency-digital converter,
M - memory
Due
to use of a counter as a converter of analogue quantity to digital, the
resolution depends on the counter capacity and the measurement time. Selecting
an appropriate gating time with the use of high capacity counter one may obtain
a simple converter with resolution of 16 bit or higher, which when converting
voltage may be difficult. Advantages of f/D conversion faced to A/D conversion
are availability of precise standards.
Multi-parametric measurement systems often use channels with voltage and
frequency data carrier (fig. 2). The author often participated in
elaboration of industrial measurements systems, in which both voltage and
frequency channels have been used [4]. Frequently the frequency modulated
signals come from incremental encoders used in measuring rotation speed [5].
Obtaining the same sampling instants with multi-channel signal
acquisition with frequency carrier is possible when a method of spectrum
reconstruction with uneven sampling [6] or sampling instants conversion for
digital signal. The author suggested methods making it possible to obtain
measurement results with constant frequency or in the moment of signal edge in
one of the channels [7].
The task gets more complicated with combination of both measurement
circuit types (voltage and frequency). The information about the signal value
should be obtained not only with constant and identical frequency but it is
also required to gather it in the same instants. Therefore, a method for
derivation of the signal values in frequency channels in the same instants as
those of triggering the measurements in voltage channels has been elaborated.
2.
Method assumptions
The frequency of pulse signal in the measurement channel with frequency
carrier is a function of the measured quantity. The simplest method of determining
the frequency of the pulse signal in any instant tk is via measurement of the distance between two
instants of this signal: preceding instant tk
and following the tk
instant (period measurement Ti).
If the signal frequency varies during measurement due to a change of the
measured physical quantity and simultaneously with longer pulse signal period,
the average value of the measured quantity between two pulses as a quantity
obtained from measurement, may be different from the instant value during
sampling time. (fig. 3) [8].
Fig.
3. Dynamic error Δdx in measurement
of pulse signal period:
x(tk)
– measured quantity in tk
instant,  - mean value
of measured quantity in Tm
time
Therefore a better solution is to determine the value of frequency from
two neighboring periods with the assumption of linear frequency change and that
the value of frequency fi
obtained from period Ti
measurement is equal to instant frequency value in the middle point of this
period.
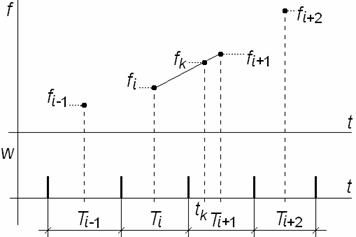
One may accept the value of frequency fk in the tk
instant as the value obtained from two neighboring periods, assuming that the
frequency changes linearly during these periods. Depending on the position of tk instant Ti and Ti+1 (fig. 4a) or Ti+1 and Ti+2
(fig. 4b) are these periods [9].
For ![]() we calculate fk frequency form formula
(1), and for
we calculate fk frequency form formula
(1), and for ![]() from formula (2).
from formula (2).
a)
b)
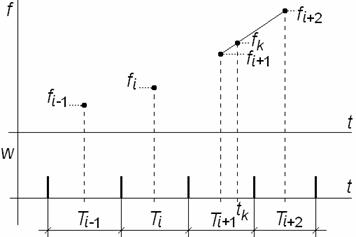
Fig.
4. Frequency measurement from two periods:
a) for ![]() , b) for
, b) for ![]()

(1)


(2)

In the tk instant
the voltages in voltage channels are sampled simultaneously with frequency
measurement.
3.
Method description
The presented principle of measurements requires synchronizing of the
sampling of the voltage signal and connected to the sampling instants
measurements of period lengths of the pulse signal. This is achieved by using
of the external timing signal.
Full measurement for single channel with frequency data carrier is
performed with the use of two counters operating continuously in a buffered
mode. First of them counts the reference pulses along with consecutive periods
of the pulse signal which are recorded in memory. The second one counts the
reference signal pulses between the pulse of sampling start and the nearest
pulse of the pulse signal.
In each pulse instant of the timing signal the S&H module gets the
voltage value, converted then by the A/D converter into the digital form.
Simultaneously a number of the last measured period is stored in the memory
(the number of periods measured until the given timing pulse).
As a result for two-channel acquisition (one voltage and one frequency
channel) after the measurement four mono-dimensional tables are placed in the
memory:
·
voltage samples converted to digital
form : U1, U2, … , Um,
·
pulse signal periods indices for the
timing instants : a1, a2, …, am,
·
lengths of periods of pulse signal: T1, T2, … , Tn,
·
distances between the sampling pulse
and the nearest pulse of the pulse signal: τ1,
τ2, … , τp.
Fist two tables have equal number of m elements. The fourth table in
case the longest pulse signal period is smaller or equal to the sampling period
(max Ti ≤ Ts), has the same number of
elements as the two first tables (p = m) (fig. 5).
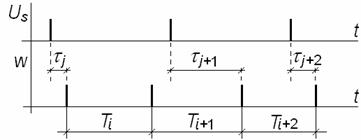
Fig. 5. Sampling for max Ti ≤ Ts
If however the longest period of the pulse signal is greater than the
sampling period (max Ti > Ts), the fourth table may
have less elements than the first two tables (p ≤ m).
This is due to operation of counters in the mode of measuring the distance
between the pulses of different signals. After the pulse starting the
measurement it is terminated with the first pulse of the second signal, no
matter if next pulses will appear in the first signal (fig. 6).
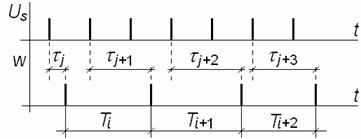
Fig. 6. Sampling for max Ti > Ts
In order to consider the “left over” distances τj between pulses of two signals in the fourth
table, it is necessary to insert instead of a single element τj for τj > Ts a w number of elements τ’1,
τ’2, …, τ’w
(fig. 7), where:
![]() ,
, ![]() ,
,
(3)
![]()
 (4)
(4)
and
trunc[x] means the integer part of the number x.
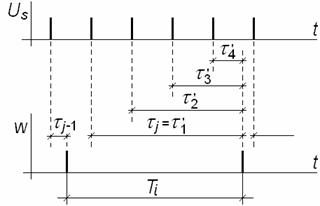
Fig. 7. τp table conversion
In this manner we obtain the table τ1,
τ2, … , τm with m elements, where the consecutive value
correspond to distances between each sampling pulse and nearest pulse of the
pulse signal.
The values of the frequency fk
of the pulse signal for the instant of k
pulse of the timing signal is determined on the basis of formulae (1, 2) from
two periods (![]() and
and ![]() or
or ![]() and
and ![]() ) and distance
) and distance ![]() , where ak is the index of the
preceding period of the timing pulse.
, where ak is the index of the
preceding period of the timing pulse.
For ![]() frequency fk is calculated from:
frequency fk is calculated from:

(5)

But for ![]() the frequency fk is calculated from the
formula:
the frequency fk is calculated from the
formula:

(6)

After this operation of measurement in two channels (one voltage and one
frequency) we obtain two mono-dimensional tables:
·
voltage values: U1, U2,
… , Um,
·
frequency values obtained for the
same sampling instants: f1,
f2, …, fm.
Obviously the number of channels in which the measurement is performed
can be larger. For voltage channels its limit is set by the amount of S&H
modules, for frequency channels by the amount of counters (two counters per one
channel
4.
Summary
The article presents a method that allows integration of measuring
channels with voltage and frequency data carrier in one acquisition system. It
makes it possible to obtain information about the signal values in the same
time instants. The described method can find its application when the results
of multi-channel recording are used to find relations between particular
quantities, fluctuating with great dynamics.
The presented method can be used as well in a microprocessor autonomy
device as in virtual instrument [10]. In order to get it working as a virtual instrument
it is necessary to use voltage signal acquisition module, counter systems
module and additional generator operating as a timing source, determining
sample instants.
The presented method is applicable for off-line analysis, when data
processing is made after the measurement. For on-line analysis the method must
be modifies in such a way that the value of the frequency in the sample instant
is extrapolated on the basis of the length of two preceding periods prior to
sampling instant [11].
5. Reference
[1] Świsulski D.: Systemy pomiarowe. Laboratorium.
Wydawnictwo Politechniki Gdańskiej, Gdańsk 2001.
[2] Kirianaki N. V., Yurish S.
Y., Shpak N. O., Denega V. P.: Data acquisition and signal processing for smart
sensors. John
Wiley & Sons, Ltd, Baffins Lane 2002.
[3] Świsulski D.: Cyfrowa rejestracja
sygnałów impulsowych z częstotliwościowym nośnikiem
informacji. Wydawnictwo Politechniki Gdańskiej, Gdańsk
2006.
[4] Galewski M., Wołoszyk
M., Świsulski D., Porzeziński M.: Revitalization of building machines
for road engineering applications. Proceedings of International Conference on
Clean, Efficient & Safe Urban Transport CESURA’03, Gdańsk/Jurata,
[5] Świsulski D.: Effect of
the incremental encoder's errors while measuring the angular velocity.
Proceedings XIV IMEKO World Congress "New measurements - challenges and
visions", 1-6 June 1997,
[6] Jenq Y. C.: Perfect
reconstruction of digital spectrum from nonuniformly sampled signals. IEEE
Transactions on Instrumentation and Measurement, vol. 46, No 3, June 1997, p.
649‑652.
[7] Świsulski D.:
Elimination of errors due to measurement-time variation in continuous
measurements of time-encoded signals. Proceedings of 9th International Fair and
Congress for Sensors, Transducers & Systems SENSOR’99, vol. 2, Nürnberg,
[8] Świsulski D.: Selection
of PFM signal period for T/D conversion. Proceedings XVI IMEKO World Congress
IMEKO 2000.
[9] Świsulski D.: Wielokanałowa akwizycja z
torami pomiarowymi z napięciowym i częstotliwościowym
nośnikiem informacji. Pomiary Automatyka Kontrola, nr 6/2006, p.
27-29.
[10] Lesiak P., Świsulski D.: Komputerowa technika pomiarowa w
przykładach. Agenda Wydawnicza PAK, Warszawa 2002.
[11] Referowski L., Świsulski D.:
Digital measurement of frequency with linear interpolation in dynamic states.
Elektronika ir elektrotechnika, nr 4(76)/2007, p. 47-50.