Comparative
qualimetric analyze of students quality management
education system
Candidate
of Engineering Sciences Koldaev V.D., Doctor of Science, Full Professor Lisov
O.I.
National Research University
of
Electronic Technology (MIET),
Moscow, Russian Federation
According to the concept of Russian education modernization, special
attention is paid to education quality problems, especially to problems of
developing and introduction quality management systems in the education institutions, that have the following
advantages: system training approach on an International Organization for Standardization basis
(ISO 9000, ENQA), application principles of Total Quality Management by teachers (TQM).
introduction of initiatives and modern methods of quality management; getting objective
processes evaluation based on facts,
that can be improved; agreed understanding for the necessary actions on the
main university directions; the possibility to recognize and promote progress
of departments, professors and cooperators [1].
Qualimtery
as a science of quantitative methods quality evaluation, has formed at the end
of the sixties years of the XX century and was needed for effective and
scientific confirmation of quality management systems for produced production.
At the end of the eighties years there has been formed qualimetry formation – the science of measurement and quality
evaluation for different objects and processes of educational system. At the
nineties years of the XX century text
qualimetry has been got a wide circulation, that was used for federal
centralize testing. The education quality control has the following functions:
— monitoring (checking of
the students skills, their mental progress and rational academic work);
— training (systematization
of knowledges and skills);
— diagnostic (information
about number and character of mistakes, omissions in students skills and
knowledge);
— prognostic (creating
advanced information according to educational process);
— developing (Stimulating of
students recognizing activity, development of their creative abilities);
— orienting (information
about the degree of purpose`s achievement by the individual student or for all
the group);
— educative (responsible
attitude to education, behavior, accuracy and honesty).
There are different
methods of evaluation holding uses in qualimetry. Depending on what the objects
it`s necessary to rate, they are change because of objects pertaining to any
area. There are educational qualimetry theories uses in the qualimetry analyzes
making, based on principles of invariance and discreteness [2].
Pragmatic methods is a set of methods for heuristic character
information processing, source of what are the experts ratings. Experts ratings
are creating by individual expert or by experts group. Extrapolation methods are based on mathematics and statistics
methods of information processing and forecasts. To identify patterns of
development, the data are presenting in the time series form for recognition
cycles, trends and random oscillations. Casual
methods are based on ‘cause and effect’ contacts between the events, in
which one of the elements is a cause of other one, derivative of them.
Depending on connections between the events (quantities), there are packing out
casual forecasts: deterministic - in which the forecast is compiling upon
determinate condition; stochastic - when memorandums between the values are not
determined unambiguously. Statistical
methods are the factors of intellectuality management growth level by
reason of using mathematic, graphical and algorithmic models.
Evaluation
of educational process quality is based on pedagogical monitoring, that has the
following crucial objects: that is the evaluation of final result and control
of correctness for that attainment. The system monitoring of educational
process quality is determinate independently mesocycles: control upon applicants acceptance; tests and exams;
knowledges of subjects cycle; control on university graduating. In the
structure of 4-years macrocycle are realized the reference points, that
complete mesocycles (fig.1).
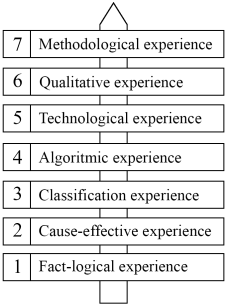
Fig.1. The hierarchical structure of educational
macrocycleshe
Weight coefficients section
of humanitarian and social-economic training (HSE), mathematics and natural
science training (NS), general professional training (GP) and special subjects
training (SS) were established by methodological university councils and
departments.
Experts
were independent in a section way of their mention about experiences,
knowledges of the students, that were in the selection. Students could use exam
ticket, test, restrict for group or individual interview. They formed their own
final mention by evaluation range order in this way:
M – the middle level;
H – middle-up level;
L – middle-down level.
Qualimetric table shows the results of education quality on the one of
the university educational programs.
Table. The results of
measuring the quality of education
|
Student |
Expert mention about
education quality of the subject`s section |
The result of measurement
education quality |
|||||
|
HSE |
NS |
GP |
SS |
The level of quality |
|||
|
Weight coefficients |
L |
M |
H |
||||
|
0,19 |
0,11 |
0,386 |
0,313 |
Indicator of quality |
|||
|
1 |
M |
M |
M |
M |
|
0,5 |
|
|
2 |
M |
H |
M |
M |
|
|
0,555 |
|
3 |
H |
H |
H |
H |
|
|
1,0 |
|
4 |
M |
H |
M |
M |
|
|
0,555 |
|
5 |
L |
H |
M |
M |
0,46 |
|
|
|
6 |
H |
M |
H |
H |
|
|
|
|
7 |
L |
H |
M |
L |
0,3035 |
|
|
|
8 |
M |
M |
M |
M |
|
0,5 |
|
|
9 |
M |
H |
M |
M |
|
|
0,555 |
|
10 |
M |
H |
M |
M |
|
|
0,555 |
|
11 |
M |
H |
M |
M |
|
|
0,555 |
|
12 |
M |
H |
H |
H |
|
|
0,905 |
|
13 |
H |
H |
H |
H |
|
|
1,0 |
|
14 |
M |
M |
M |
L |
0,3435 |
|
|
|
15 |
M |
H |
H |
H |
|
|
0,905 |
|
16 |
M |
H |
M |
M |
|
|
0,555 |
|
17 |
M |
M |
M |
M |
|
0,5 |
|
|
18 |
M |
H |
M |
M |
|
|
0,555 |
|
Indicator of experience quality |
0,5278 |
0,8611 |
0,6389 |
0,5833 |
The average mean of the experience quality |
||
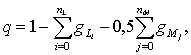
Convolution of the measuring information on the each of training section,
that shows in the non-numerical form:
![]()
where nL – the number of mentions
denoted by the letter ‘L’;
nM – the number of mentions denoted by the
letter ‘M’;
n – common number of the mentions equal to number of
the students in selection.
Number value of education quality indicator for each student, that has
entered to selection, was founded in view of number coefficients [3]:
where ![]() – weight coefficient ‘i’ of the educational subjects sections,
in which experiences, skills and knowledges named by letter ‘L’;
– weight coefficient ‘i’ of the educational subjects sections,
in which experiences, skills and knowledges named by letter ‘L’;
![]() – number of mentions,
denoted by the letter ‘M’;
– number of mentions,
denoted by the letter ‘M’;
n – weight coefficient of the educational subjects
section ‘j’, in which experiences,
skills and knowledges named by the letter ‘M’;
In the
qualimetric table the result of educational quality measurement for each
student, that entered to section, calculated by three-level range order. The
solution according to the student can be taken by these rules: whether q > 0,5 then student takes the
certification; otherwise not.
Numerical
form of summarize indicator of quality for each specialization or training
direction calculated by that formula:
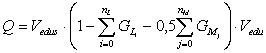
where ![]() – weight coefficient ’i’ of quality indicator, сonsolidated mention about
named by the letter ‘L’;
– weight coefficient ’i’ of quality indicator, сonsolidated mention about
named by the letter ‘L’;
![]() – weight coefficient ’j’ of quality indicator, сonsolidated mention about named by the letter
‘M’;
– weight coefficient ’j’ of quality indicator, сonsolidated mention about named by the letter
‘M’;
nL – common number of the quality indicators, consolidated mentions about
named by the letter ‘L’;
nM – common number of the quality indicators, consolidated mentions about
named by the letter ‘M’;
Vedus – coefficient veto of the first indicator educational quality;
Vedu – coefficient of the common educational quality indicator;
If Q < 0,5 then training direction
doesn`t take certification; if 0,5 <= Q
< 0,6 then training direction takes the certification on the 3 years; if Q >= 0,6 then training direction
takes the certification on the 5 years.
If use more habitual
selection of the reference points, that marked by balls, then: «5» – great; «4» –
good; «3» – satisfactorily; «2» – not satisfactorily, then selection of
measurement information calculated by the formula:
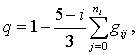
where i = 2,3,4,5 – traditional mark; gij –
weight coefficient of the section ‘j’, that based on the mark named ‘i’; ni
– number of the ‘i’ marks.
As shown by the experiment, it`s not necessary to worth time for
operative decision-making, and sense the differences between «3» and «4» or «4»
and «5». Efficiency of the diagnostic technique confirmed by the positive
dynamics of the students experimental group indicators. Formedness of the
professional abilities grow up from 5% to 15% for the advanced level, from 20%
to 25% for the basic level.
Literature
1. Koldaev V.D. Qualimetric
analysis of the quality of subject-centered concepts of educational services
[Text] / V.D. Koldaev // "Personality development in contemporary Russian
society." Monograph. Part I. / Under scientific ed. Ph.D., Professor. G.F.
Grebenshchikova. - M .: Publishing House "pen", 2011. - S.134-167.
2. Koldaev V.D. Qualimetric
approach to analyzing the quality of educational services [Text] / V.D. //
Koldaev defense complex - scientific and technological progress in Russia:
Interdisciplinary scientific and technical journal. - M .: FSUE
"VIMI", 2011. - Vol. 3. - S.77-85.
3. Koldaev V.D. Modeling of
the educational system of accumulation of knowledge to predict and control the
quality of training of students on the basis of technology foresight [Text] /
V.D. Koldaev // "Selected problems of modern science." Monograph.
Part IV / Under scientific ed. Ph.D., Professor. S.P. Akutinoy. - M .:
Publishing House "pen", 2011.- S.142-173.