Технические науки / 12. Автоматизированные системы
управления на производстве
Kulyk A.J., Kulyk J.A, Kulyk A.A.
Vinnytsia National Technical University
Comparative analysis of the spectrum signals in
different bases
|
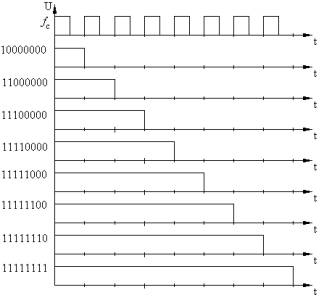
Fig.
1 – Possible formation of pulses of
different duration |
 Because of the
generalized characteristics include bandwidth, which is a signal, the important
role played by the analysis of process harmonic structure of transmission
signal. In the optical carrier spectrum practically does not affect the process
of transmission, but use on entrance and exit of various electro converters
(modulators, demodulators, etc.) requires the analysis frequency band signal.
Similar conclusions can be drawn for the case of use of radio channels in
computer networks. In most literature considered range of frequencies that
occur when single pulse of different forms [1]. However, the lines are
superposition of harmonic components of different pulses, so you need to
consider spectrum code combinations [2].
Because of the
generalized characteristics include bandwidth, which is a signal, the important
role played by the analysis of process harmonic structure of transmission
signal. In the optical carrier spectrum practically does not affect the process
of transmission, but use on entrance and exit of various electro converters
(modulators, demodulators, etc.) requires the analysis frequency band signal.
Similar conclusions can be drawn for the case of use of radio channels in
computer networks. In most literature considered range of frequencies that
occur when single pulse of different forms [1]. However, the lines are
superposition of harmonic components of different pulses, so you need to
consider spectrum code combinations [2].
In all cases informative code pattern is transmitted
continuously and thus can be formed eight different pulse durations, when the
code pattern containing one, two, ..., eight units, located near (fig. 1).
Depending on the specific code combinations can displacement pulses by
time axis may have their order, but these eight durations are the base for a
particular transmission speed, and they determine the bandwidth occupied by the
signal. Critical among them are: 10111111V (BFH) and 11111101B (FDH), in which
the difference between the pulse duration is maximal.
The duration of these pulses can be determined by the frequency
synchronization of the serial port, which is directly connected with the speed
of information transfer
where ![]()
![]() – frequency sync serial port that corresponds to the speed of information
transmission;
– frequency sync serial port that corresponds to the speed of information
transmission;
i – i – number
of units consistently located in the code pattern;
v – v – speed of information transfer, bits/s;
km – km – scaling factor that
determines the transmission line between speed and frequency synchronization,
mostly it is 1 Hz/s.
Frequency spectrum, defined in the Fourier basis functions for the first
code combinations represents the expression

![]() . (2)
. (2)
for bipolar signals. For
unipolar signal this expression takes the form

![]()
![]()
![]() .
(3)
.
(3)
When harmonic (sine and cosine) excitation, fluctuations retain its
shape during their passage through any linear system, output fluctuations may
vary from the front while only the amplitude and phase. These frequency-based
research methods associated with the definition of energy spectrum signals.
However, Fourier transform inherent disadvantage, which deprived the
Walsh and Haar transform [3]. In the field of communications, and other
industries transform often implemented in real time is important to minimize
the time machine operations. For Fourier transforms, a significant positive
step was the development of various fast transform algorithms, but still kept a
large number of multiplication operations, which occupy most of the time
machine cultivation data. Multiplications are carried out one after another
during the expansion of functions in Fourier series and by performing a Fourier
integral.
Decomposition algorithm functions in the Fourier series is to determine
the coefficients
 .
.
Thus each of the
many values of a function f ( t ) should be multiplied by the value of cos kω1t specific value for
t. Determine the sum of all multiplication results, which determined the
value of the integral and then the value a k. This procedure
is repeated for all k. Similarly defined functions and sine coefficients
bk.
It should be noted
that although for some functions quite satisfactory approximation turns out to
have them in determining a small number of Fourier coefficients, but for most
real signals require fast match series is done.
For formula (4) in determining the coefficients of cosine function
instead of (or sinus in determining the coefficients bk) is
necessary to put a constant value. If the value of basic functions on the
intervals have meaning plus one, minus one or zero, it is generally no need to
perform operations of multiplication. Thus, the procedure for determining the
coefficients in the series comes down to adding operations that are far from
simple multiplication. No need to also calculate the values of sine and cosine,
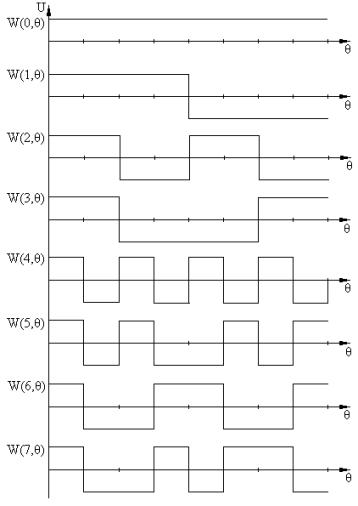
which is also quite simple. Primarily it provides a wide use of Walsh functions
in different views and Haar for building and testing both hardware and software
Walsh functions that look like, presented in Fig. 2, describes the difference equation
 , (5)
, (5)
where ![]()
![]() – the greatest integer less than or equal
– the greatest integer less than or equal ![]()
![]() ;
;
p = 0 or 1;
j = 0,1,2, ....;
wal (0; ![]() ) = 1 for
) = 1 for ![]() ;
;
wal (0; ![]() ) = 0 for
) = 0 for ![]() .
.
For comparison, the spectra of frequencies appropriate to consider the
above code combination. Since the eight bit code pattern, then the maximum
range will contain eight harmonics.
Similarly spectrum, obtained for the Fourier series expansion of functions
or code combination on Walsh functions carried out in accordance with the
formula
According to this algorithm, the range of code combinations for 11111101
unipolar signal will be

![]() .
(7)
.
(7)
For bipolar mode, the range will describe the expression

![]() . (8)
. (8)
 Thus for the
expansion and kept only the difference in the amplitude of harmonics, and not
in their stock. Difference from the classical spectrum, built on the Fourier
series is that the recovery does not contain a combination of elementary errors.
It is obvious, since the first case approximated by rectangular pulses and sine
and cosine, and full identity waveform can not achieve in principle, in the
second case, the principle of similarity and that no methodological error.
Thus for the
expansion and kept only the difference in the amplitude of harmonics, and not
in their stock. Difference from the classical spectrum, built on the Fourier
series is that the recovery does not contain a combination of elementary errors.
It is obvious, since the first case approximated by rectangular pulses and sine
and cosine, and full identity waveform can not achieve in principle, in the
second case, the principle of similarity and that no methodological error.
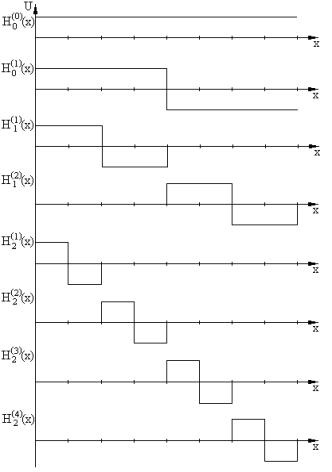
![]() Another
option is to analyze the spectrum of a signal decomposition by Haar functions
that look like, presented in fig. 3. For the formation of Haar features using
the formula [3]
Another
option is to analyze the spectrum of a signal decomposition by Haar functions
that look like, presented in fig. 3. For the formation of Haar features using
the formula [3]
![]()
N – number of molded ![]() functions;
functions;
![]() .
.
When expansion function φ ( x
) in a number of Haar coefficients of members determined in accordance
with the formula
 . (10)
|
Fig. 3 – The
first eight Haar functions |
For clarity of perception appropriate to the calculation of coefficients
in tabular form.
Table 1 – Calculation of
coefficients of expansion in the number of Haar
unipolar
combination code 11111101
Function
|
Bits |
|
|
|||||||
|
7 |
6 |
5 |
4 |
3 |
2 |
1 |
0 |
|||
|
φ(x) |
1 |
1 |
1 |
1 |
1 |
1 |
0 |
1 |
|
|
|
|
1 |
1 |
1 |
1 |
1 |
1 |
1 |
1 |
||
|
|
1 |
1 |
1 |
1 |
1 |
1 |
0 |
1 |
|
|
|
|
1 |
1 |
1 |
1 |
-1 |
-1 |
-1 |
-1 |
|
|
|
|
1 |
1 |
1 |
1 |
-1 |
-1 |
0 |
-1 |
|
|
|
|
1 |
1 |
-1 |
-1 |
0 |
0 |
0 |
0 |
|
|
|
|
1 |
1 |
-1 |
-1 |
0 |
0 |
0 |
0 |
|
0 |
|
|
0 |
0 |
0 |
0 |
1 |
1 |
-1 |
-1 |
|
|
|
|
0 |
0 |
0 |
0 |
1 |
1 |
0 |
-1 |
|
|
|
|
1 |
-1 |
0 |
0 |
0 |
0 |
0 |
0 |
|
|
|
|
1 |
-1 |
0 |
0 |
0 |
0 |
0 |
0 |
|
0 |
|
|
0 |
0 |
1 |
-1 |
0 |
0 |
0 |
0 |
|
|
|
|
0 |
0 |
1 |
-1 |
0 |
0 |
0 |
0 |
|
0 |
|
|
0 |
0 |
0 |
0 |
1 |
-1 |
0 |
0 |
|
|
|
|
0 |
0 |
0 |
0 |
1 |
-1 |
0 |
0 |
|
0 |
|
|
0 |
0 |
0 |
0 |
0 |
0 |
1 |
-1 |
|
|
|
|
0 |
0 |
0 |
0 |
0 |
0 |
0 |
-1 |
|
|
In accordance with the
drawn table function can be approximated expression
Similarly, you can create Haar spectrum and bipolar signal. The results
are listed in the tab. 2.
Table 2 –
Calculation of coefficients of expansion in the number of Haar
bipolar combination
code 11111101
Функція
|
Біти |
|
|
|||||||
|
7 |
6 |
5 |
4 |
3 |
2 |
1 |
0 |
|||
|
φ(x) |
1 |
1 |
1 |
1 |
1 |
1 |
-1 |
1 |
|
|
|
|
1 |
1 |
1 |
1 |
1 |
1 |
1 |
1 |
||
|
|
1 |
1 |
1 |
1 |
1 |
1 |
-1 |
1 |
|
|
|
|
1 |
1 |
1 |
1 |
-1 |
-1 |
-1 |
-1 |
|
|
|
|
1 |
1 |
1 |
1 |
-1 |
-1 |
1 |
-1 |
|
|
|
|
1 |
1 |
-1 |
-1 |
0 |
0 |
0 |
0 |
|
|
|
|
1 |
1 |
-1 |
-1 |
0 |
0 |
0 |
0 |
|
0 |
|
|
0 |
0 |
0 |
0 |
1 |
1 |
-1 |
-1 |
|
|
|
|
0 |
0 |
0 |
0 |
1 |
1 |
1 |
-1 |
|
|
|
|
1 |
-1 |
0 |
0 |
0 |
0 |
0 |
0 |
|
|
|
|
1 |
-1 |
0 |
0 |
0 |
0 |
0 |
0 |
|
0 |
|
|
0 |
0 |
1 |
-1 |
0 |
0 |
0 |
0 |
|
|
|
|
0 |
0 |
1 |
-1 |
0 |
0 |
0 |
0 |
|
0 |
|
|
0 |
0 |
0 |
0 |
1 |
-1 |
0 |
0 |
|
|
|
|
0 |
0 |
0 |
0 |
1 |
-1 |
0 |
0 |
|
0 |
|
|
0 |
0 |
0 |
0 |
0 |
0 |
1 |
-1 |
|
|
|
|
0 |
0 |
0 |
0 |
0 |
0 |
-1 |
-1 |
|
|
In this case the function can
describe the formula
 . (12)
Comparing expressions (11) and (12) shows that again when you change the
type of signal (unipolar / bipolar) changing only the amplitude of harmonics
and frequency remain unchanged themselves.
Based on expressions
can make some conclusions:
Ø
basis regardless of the type of signal only changes the amplitude of harmonics
rather than their composition;
Ø
shows that one and the same combination has the longest range in the Fourier
basis functions (up to 15th harmonics included), and in basis functions orthogonal
rectangular range is considerably reduced and not exceed eight harmonics;
Ø
if the test is done in a certain basis functions, then all the equipment
(and especially filters) to build in the same basis.
REFERENCES:
1.
Шварцман В.О., Емельянов
Г.А. Теория передачи дискретной информации. – М.: Связь, 1979 – 424 с.
2.
Кулик А.Я., Компанец
Н.Н., Кривогубченко Д.С. Энергетический спектр сигналов при передаче информации
оптическими линиями связи // Вимірювальна та обчислювальна техніка в
технологічних процесах. – 2000. – № 1. – С. 50 – 51.
3.
Залманзон Л.А.
Преобразования Фурье, Уолша, Хаара и их применение в управлении, связи и других
областях. – М.: Наука, 1989. – 496 с.