Engineering science / 3. Branch
mechanical engineering
Nikolay
D. Andriychuk, Inna K. Nasonkina,
Anatoliy A. Guschin,
Aws
Mohammed Abdul Jaleel
East Ukrainian National
University, School of Technical
Вuilding
MATHEMATICAL SIMULATION AND ANALYSIS OF THE VARIABLE-DISPLACEMENT
VANE-PUMP DYNAMICS
Variable-displacement
vane-pumps, modulated by a pivoting cam, are used extensively in modern
automotive transmissions. This paper presents a study of the dynamic and
steady-state characteristics of such pumps. Their dynamics concern issues such
as pressure fluctuations due to the dynamics of the internal mechanism and transient
response-time. Their steady-state characteristics concern limits on the operating
envelope and the relationships among the operating variables. These analyses required
the development of several models for this type of pump at different levels of
detail.
Growing
energy costs continue to motivate the use of variable-displacement pumps in
hydraulic systems with varying flow requirements. Variable- displacement pumps
are already used widely in various industrial and automotive applications [1, 2].
To fully realize their economic potential, these pumps should be carefully designed
and controlled. Unlike in fixed-displacement pumps, the mechanisms of variable-displacement
pumps respond to the internal forces which develop during operation. These
forces determine the dynamic nature of the pump, and can affect the dynamics of
the entire hydraulic system.
With no analytical models available for these pumps, their regulation
and the related system design are often conducted experimentally. Since many
operating variables and design parameters influence the pump, this approach may
lead to rather frustrating results. Solutions which are applicable to one set
of parameters at a given operating point may worsen performance under different
conditions, and minor design changes may lead to unpredictable results.
Moreover, the lack of analytical models for the VDVP impairs the engineer's
ability to estimate the dynamic behavior of a new system. Consequently, the
purpose of this study was to develop models for the VDVP which would facilitate
analysis of the pump dynamics and its steady-state performance characteristics.
Figure 1 displays a schematic of the VDVP analyzed in this study. The
pump consists of: the housing, the cam, the vanes, the seal, the priming
spring, shaft and rotor, pivot.
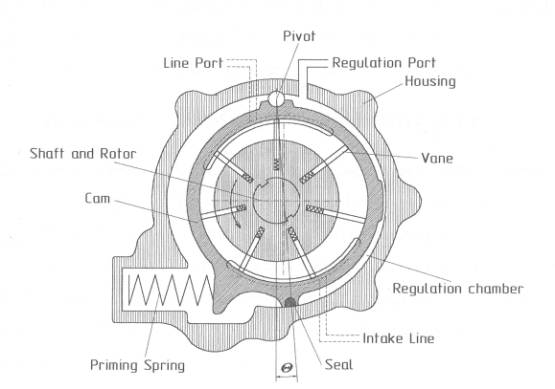
Fig. 1 Schematic of the
variable-displacement vane-pump
Its displacement varies by motion of a circular cam which pivots about a
point fixed with respect to the housing, thereby varying the pump offset. This
offset, known as eccentricity, can be measured by either the linear distance
between the centers of the cam and the shaft, or by the angle θ
shown in Fig. 1. In this
study, the eccentricity will be measured by the angle θ only [3]. The main parts of the
variable-displacement vane-pump are rotor which with eccentricity is put into
the fixed ring of the cam. The vanes are into the rotor's groove. The vanes
move radially at the rotation of the rotor. Its outside ends slide on an
internal circle of the stator. The ports are gashed into the stator. The ports
are connected with intake line and line port. The working volume of the
displacement machine is limited by the stator's radius and the active rotor's
radius.
The pump regulates due to mobile stator and the presence
pressure-regulation valve in an external contour of circulation of the working
liquid. The function of the pressure-regulation valve is to support a constant
pressure despite of change of capacity. When the capacity changes the overfall
of the pressure increases on the throttle. The pressure-regulation valve passes
the part of flow into the pump's regulation chamber. The stator overcomes the
force of the spring and rotates around the pivot under the pressure in the
regulation chamber. The output flow depreciates and the discharge pressure
balances because of a shortening eccentricity.
The "Exact" model - №1.
Disregarding leakage effects (which depend on pressure), the eccentricity of
the VDVP uniquely determines its capacity. For a given load, the pump capacity
determines the other operating variables. Consequently, analysis of the
eccentricity dynamics corresponds to analysis of the pump dynamics. Equation (1) models the eccentricity dynamics as a
single degree of freedom motion, governed by the torques applied to the cam
about its pivot (neglecting dry friction):
 (1)
(1)
where:
 ,
(2)
,
(2)
where:
Jp - moment of inertia of the
VDVP cam about its pivot;  - angular eccentricity of the VDVP cam;Bp
- viscous-damping coefficient of the VDVP cam
- angular eccentricity of the VDVP cam;Bp
- viscous-damping coefficient of the VDVP cam  ; ζp - damping ratio of the cam;
 ; Kpr - priming-spring
rate; Rp - distance between the pivot of the cam and
the priming-spring center axis; Tep - torque applied
to the cam by fluid external to the cam; Tip - torque applied to the cam by fluid
internal to the cam; Tsp -
preset torque applied to the cam by the priming spring; W -
axial width of the cam; Rs - distance between the
pivot of the cam and its sliding tip; Pd
- control pressure.
; Kpr - priming-spring
rate; Rp - distance between the pivot of the cam and
the priming-spring center axis; Tep - torque applied
to the cam by fluid external to the cam; Tip - torque applied to the cam by fluid
internal to the cam; Tsp -
preset torque applied to the cam by the priming spring; W -
axial width of the cam; Rs - distance between the
pivot of the cam and its sliding tip; Pd
- control pressure.
With the analytical
expressions for Tip [3], equation (2)
becomes:
 ;
;  . (3)
. (3)
Where: R
- the inner radius of the cam; D- distance between the center
of the cam and its pivot; Pi
- the pressure in chamber; Ψ2, Ψ1 - the
instantaneous angular position of the leading and trailing vanes of chamber i
with respect to the cam center; =1,5- constant coefficients in the VDVP's
equation of motion; nc
- number of VDVP chambers.
=1,5- constant coefficients in the VDVP's
equation of motion; nc
- number of VDVP chambers.
This model will be referred to as the "exact" model, or model
№1. It is most suitable for studying the dynamics of the fluctuations of the
internal mechanism of the pump. However, this model, when used in a numerical
simulation, requires small and speed-dependent time-steps. In addition, it does
not lend itself readily to control analysis. For such applications, i.e.,
numerical integration, model expansion, and control analysis, this model must
be simplified.
The "Approximate" model - №2.
Simplification of the "exact" model can be achieved based on the
periodic nature of Tip. Tip is a
sum of two periodic components [3]:
•
A continuous component due to the exposure of chambers to the line port
which appears as a sawtooth waveform at twice the vane frequency (the frequency
of vane passage at the ports).
•
An intermittent component due to fluid compression in the dead volume
which appears as a pulse train at vane frequency.
When the vane frequency is large relative to the natural frequency of
the cam, Tip can be approximated by the mean level of
its periodic components.
The mean of the periodic components of the torque was calculated as a
sum of the means of the continuous and intermittent components, for a 100 mm
diameter VDVP. It resulted in the following model for the pump dynamics:
 . (4)
. (4)
This model will be referred
to as the "approximate" model №2.
Here: F0 - force applied to the VDVP cam by the
priming spring at Θ=0°;
Pt - line pressure; Ω -
shaft rotational speed (r/min).
The simplified formulation of the VDVP dynamics (equation (4)) facilitates
the study of the influence of design and operating parameters on the pump's performance:
•
b0 represents torque applied to the cam by the dead volume at 0° eccentricity
due to the offset of the cam center with respect to the shaft center.
•
b1 represents a combination of two effects associated with the line pressure:
(a) a negative net contribution of the
sawtooth waveform to the mean torque, and (b) a positive contribution related
to the leakage from the dead volume - the higher the line pressure, the smaller
is the pressure difference between the dead volume and its adjacent
line-pressurized chamber, thereby reducing leakage through this path. Reduced
leakage maintains a higher dead-volume pressure, with subsequent higher positive
contribution to the mean torque. However, the first effect clearly dominates
over the second one, resulting in a negative b1 value.
•
by regrouping b2θ
and b3Pt
with Kpθ, the priming-spring stiffness transforms
into an "effective stiffness" constant which includes the effects of
line pressure and eccentricity. In this expression, b2
represents the dead-volume effect which may oppose or support the priming-spring
action, depending on the leakage and the fluid bulk modulus. b3Pt
represents the line pressure effect introduced by the change in the lever arm
of the resultant pressure vector with eccentricity. The higher the line
pressure, the larger this reduction becomes. At high enough pressures, it may
cancel the priming-spring action, or even change its direction. The reduction
of the "effective stiffness" rate, as line pressure increases, lowers
the natural frequency of the cam and increases its damping ratio. Such a
reduction in the cam natural frequency provides an additional attenuation to
the periodic components.
•
b4 represents the
effect of shaft speed on leakage. At higher rotational speeds, less time is
available for leakage while pressure builds up in the dead- volume zone. As
less fluid leaks out of the dead-volume zone, the pressure drop due to leakage
is reduced, leading to a larger positive contribution to the mean torque. This
positive contribution approaches an asymptotic level at higher shaft- speeds.
An exponential formulation generated a satisfactory representation for this
effect.
The "Approximate"
model - №3. Excluding the effect of the dead-volume pressure allows for an
additional simplification of the mode. With this approach, only the exposure of
the chambers to the line port contributes to the mean of Tip.
It results in the following model:
 , (5)
, (5)
which will be referred to as the "approximate" model №3.
Model evaluation and validation. The three
models described above were evaluated for steady-state and transient operation
using a numerical simulation program.
Results for both steady-state and dynamic operation are presented as
spatial histories of:
• The "exact" instantaneous torque
applied to the cam.
•
The eccentricity as predicted by an "exact" model and an
"approximate" model.
Results are plotted against shaft angle (as opposed to time) to
eliminate the shaft-speed dependence in the presentation of the data. Each case
presents five to six periods of pump operation.
Steady-state operation. Figure 2
displays steady-state operation when the dead-volume effect is excluded. It
shows traces which correspond to two different line pressures. In both, the dynamic
sawtooth waveform is similar to that shown in Fig.2 of reference [3] under
fixed-eccentricity conditions.
The torque amplitude is proportional to the
line pressure and cycle-to-cycle variations are minimal. Moreover, the mean
level of the "exact" eccentricity oscillations practically coincides
with the fixed "approximate" (model №3) level.
This agreement repeats whenever the
dead-volume effect is excluded. However, as shown later, when included, the
dead-volume contribution results in a steady-state bias. The bias is due to the
method of calculating the dead-volume contribution in the simplified model,
which excluded dynamic effects. In all cases, model №3 underestimates the
dead-volume effect; however, the bias varies substantially with parameter
changes. Figures 3 and 4 compare models №1 and №2, including the dead-volume
contribution. The cases examined in Figs. 2.3 and 2.4 differ in the shaft speed
- 1000 r/min and 3000 r/min, respectively. The pump damping ratio is identical
in both, ζp = 3.
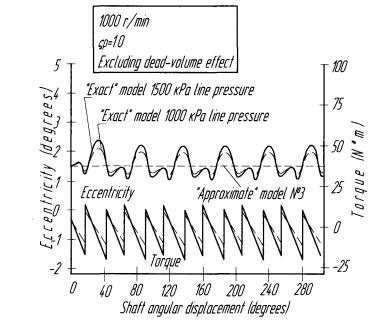
Fig.
2. The "exact" and the "approximate" models at steady-state
- no dead-volume effect, moderate shaft-speed
Each of these figures displays eccentricity traces, with and without
leakage in the dead-volume zone. Both figures show that no-leakage conditions
in the dead volume produce high-amplitude torque-spikes. (The insets magnify
the torque trace of one spike along the horizontal scale while compressing it
vertically.) The cycle- to-cycle variations of the torque-spikes (amplitude as
well as duration) are small. Compared with its fixed-eccentricity level [3],
the durations of the dead-volume torque-spikes are lower in all cycles. The
decrease in the torque-spike duration under dynamic conditions is a result of
the spike pushing the cam toward higher eccentricities, while it is still in
the dead-volume zone. With the high bulk-modulus of the fluid, even a small
increase in the eccentricity depressurizes the chamber. Consequently, the
"approximate" model №2 overestimates the effect of the dead- volume
torque-spikes even under no-leakage conditions (although this would be the highest
possible effect the dead volume can have).
The peaks of
the dead-volume torque-spikes shown in fig. 3 are lower than the peaks shown in
fig. 4. These lower peaks are a result of the lower shaft-speed. As the frequency
of the torque-spikes decreases, the cam has more time to move, thereby decreasing
the torque-spike level and duration. With the reduction in the dead-volume
effect, the bias grows between the "exact" and the approximate models.
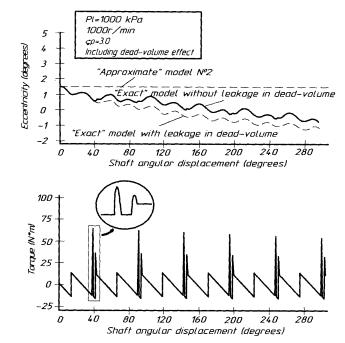
Fig.
3 The "exact" and the "approximate" models at steady-state
- with dead-volume effect, moderate shaft-speed
Like the line pressure, the vane frequency has a significant effect on
the amplitude of the eccentricity oscillations. Lower vane frequencies
increase the amplitude of the eccentricity oscillations, due to the increased
transmissibility of the higher harmonics. High-amplitude oscillations, i.e.,
larger cam displacements, lead to higher fluid-compression in the dead-volume
zone. Therefore, lower vane- frequencies result in higher dead-volume
torque-spikes.
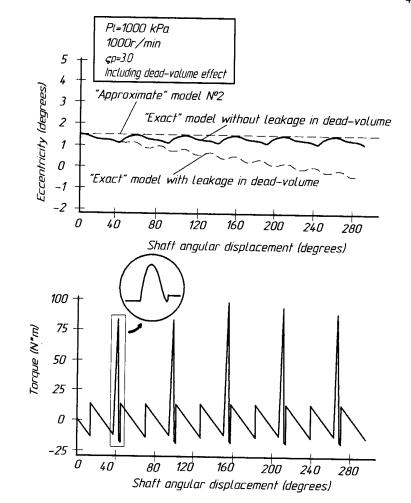
Fig.
4 The "exact" and the "approximate" models at steady-state
- with dead-volume effect, high shaft-speed
Model validation. The previous simulations
indicate that a simplified model, based on mean torque, can represent the pump
dynamics under conditions of low- amplitude eccentricity-oscillations. However,
the model's predictions are invariably biased. The degree of the bias depends
on dead-volume effects, and, consequently, will vary between production units
and under different operating conditions. Therefore, in evaluating the model's
predictions, a range of values must be considered, rather than single-value
estimates. The bounds of this range are the predictions of the two simplified
models, with and without dead-volume effects.
Consequently, the validation of the model was conducted against such a
range. The upper limit represents maximum dead-volume bias, while the lower one
represents zero dead- volume bias. Model №2 determines the upper limit,
assuming no reduction in the dead-volume pressure due to either leakage or cam
motion; it is fluid dependent since the predicted pressure is a function of the
fluid bulk-modulus. Model №3 determines the lower limit, i.e., the dead-volume
compression is assumed to be fully relieved. All test results are well within
the range established by the limits. Moreover, the slopes of linear-regression
lines of the data (not shown) agree well with the predicted slopes. These
slopes represent the effect of the continuous component of the torque on the
cam due to the exposure of the pump's chambers to the line port. This effect
does not include the dead-volume contribution. Similar slope agreement repeated
at other shaft-speeds.
References
1.
Коваленко
А.А., Соколов В.И. Основы объемного гидравлического привода строительных и
дорожных машин/ А.А. Коваленко, В.И.Соколов. – Луганск: Из-во ДонГАСА, 1999. –
138 с.
2. Андрийчук Н.Д. Гидравлика и
гидропневмоприводы/ Н.Д. Андрийчук , А.А. Коваленко , В.И.Соколов. – Луганск: Изд-во ВНУ им. В. Даля, 2008. – 320 с.
3. Karmel, A. M. A Study of Internal Forces in
a Variable-Displacement Vane Pump – Theoretical analysis. – ASME Journal of
Fluidics Engineering/ Vol/ 108,# 2, June 1986, pp 227-232.