assistant
- professor Assel K. Jumasseitova
Kazakh British technical University
Socio -economic development and Integration. Causal
effect.
Economists have generally
devoted their attention to the growth effects of economic integration. There are ongoing debates about criteria for
successful integration and the relationships between membership in integration
blocks and subsequent sustainable development.
Russian and Kazakhstani papers
study integration through different criteria. Thus, effectiveness of integration is seen
through the high economic growth, while reducing the cost of inputs due to
optimal utilization and increase the production (Radzhapova Z.K., 2005). The
intensity of the integration of relations is based on such indicators as the
share of exports relative to the total volume of exports, the commodity
structure of mutual exports, indicating the extent of specialization and cooperation,
the absolute and relative values of the reciprocal and direct investment
(Shishkov Y.V.). Quantitative
assessment of factors affecting the macroeconomic indicators of development,
industry structure, investment potential and living standards. The coefficient
of economic dependence on external relations reflects the change in the final
production of the percentage change in the external relations at the 1% (Kazbekov B.K., 2003). Model of Russian economist Dvorkovich A.
(2000) is based on the relationship between the level of GDP, state budget,
investment flows and the state of foreign trade. Most of the
Kazakhstani authors pay much attention
on theoretical aspects of
integration.
The link between trade integration and economic growth
has been emphasized by several authors (Edwards, 1993; Frenkel and Romer, 1999;
Dollar and Kraay, 2001). First of all, technological change would be
positively correlated with country’s openness. In fact, ”globalized” countries
can either learn more quickly how to produce new inputs or can import them at
lower costs increasing total factor productivity, human capital accumulation,
and overall national technological capacity (Grossmann and Helpmann, 1991;
Romer, 1992). However, other authors do not pay much attention on the role and
direction of causality between trade
and growth (Rodriguez and Rodrik, 2000). The empirical evidence from the East
Asian Newly Industrialising economies, revealed that the adoption by governments
of high level of trade protection and interventionist industrial policies
promoted growth through investment and technological learning. Trade protection
could raise long–run growth according to the old infant industry argument if
protection is accompanied by strong incentives and policies to enhance factor
accumulation and investment in research and innovation.
Experts
have long discussed the issue of Kazakhstan’s competitiveness in the global
context, identifying that greater competitiveness leads to greater economic growth and material well-being
and that growth always leads to higher
incomes for all income classes, including the poor. However, emerging countries
should be aware of particular socio-economic vulnerability that might appear
due to global integration, particularly concerning the trade.
We identified many articles
related to the topic published by Montalbano (2004, 2005, 2009). The basic
concept was to measure the relationship between trade liberalization and
socio-economic vulnerability. The result was that shock on trade openness
directly reduced the resources available for private investment and
consumption. The key point was that socio-economic well-being was worsening
because of trade shocks that occurred at the beginning of the transition era,
when observed countries were facing huge institutional and economic
liberalization. Montalbano et al.
(2004) outlined those countries with
weak institutions and imperfect and incomplete internal market risk as being worse off from international
competition and globalization. Federici et al (2007) noticed that the focus was
to develop options and strategies to help developing countries capture benefits
of trade integration minimizing the risk of negative shocks.
Montalbano
(2009) proved that the issue of trade openness in terms of economic crises was
becoming more crucial, because openness raised vulnerability to foreign shocks.
The author provided several explanations to support the statement: “the notion
that a weakening in a country’s export performance can trigger a sudden stop in
capital flows; the evidence that sudden stops in finance often extended to a
loss in trade credit and that the resulting shrinkage in trade was more painful
if trade represents a larger share of the economy; the empirical consideration
that trade openness and financial openness go hand in hand in good and bad
occurances” (Montalbano, 2009). The authors outlined that multilateral trade
liberalization together with country’s global integration has impact on income
and welfare (static effects) and on total factor productivity (dynamic
effects). The research stresses the methodology to use improved qualitative and
quantitative data, to create empirical validation, strengthen the dynamic
dimension, emphasize the role of vulnerability and uncertainty, and move
towards effective integration of the macro and micro level analysis.
To carry out our social development analysis in terms
of integration union we widened our
measure of welfare, aggregating different aspects of the countries’
socioeconomic development into a single
index. Idea of single index was
implemented for socioeconomic vulnerability analysis of shocks associated to trade
openness (Triuzli U., Montalbano P. ).
They used a
methodology of United Nations Development Programme (UNDP) for Human
Development Index (HDI). There are
three a unit-free index between 0 and 1, which allows different
indices to be added together. Having
defined the minimum and maximum values, the subindices are calculated as
follows:
- x-index =
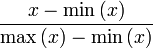 (1),
(1),
Many
indices have been developed to measure the social welfare or wellbeing of a
nation, roughly equivalent to standard of living.
There are
three dimensions represented social development - living standards, labor
supply, health. GDP per capita,
unemployment rate and infant mortality
are three components included
for index of social welfare.
The
aggregation of unemployment and infant
mortality rates is supposed to give a
better and wider comprehension of the actual socio-economic well-being of the
country. In particular, unemployment rate gives us a measure of the number of
people excluded from labour market; infant mortality rate is as a proxy of the
level of the basic sanitary conditions of the country, and quickly reacts to
their improvement. Infant mortality is
the most sensitive index we possess of social welfare ( Lathrop, 1913).
However ,
methodology of HDI includes positive correlation of all subindeces. High level
of GDP per capita is positive correlates with
our index, unemployment and
infant mortality rate have negative
correlation. In order to avoid logical
misunderstanding of index, we change
negative correlated components to employment rate and child survival rate. It
means that level of the social
development index reflects
position for each component.
We analyze members of Eurasian Economic
Community (EurAsEC) for the period
1995-2008 on which reliable and complete statistics are available. Our index of
well being has been computed for each year and each country as follows:
SWIti=
wx1X1ti + wx2X2ti + wx3X3ti (2)
where SWIti
is the composite index of socioeconomic development in period t and country i; w is the weight
of each component; X is the component.

Figure 1 – EurAzEC’s
SWIs
The
standard deviation of SWI gives a measure of the volatility of well-being for
each country in the time period analyzed, while the SWI percentage rate of
change of the period gives us a measure of the socioeconomic performance of
each country over time and on average
(Montalbano, 2009). The comparison
shows as level of volatility and worsening levels of well-being before EurAsEC
and after.
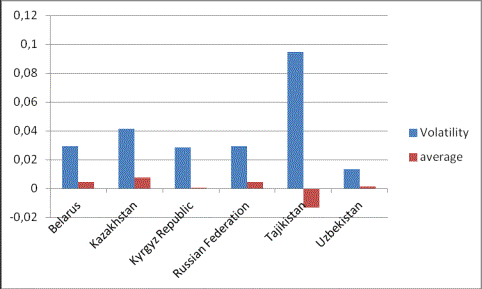
Figure 2 - A comparison between
SWI volatility and average % rate of change
of the EurAsEC (1992-2008)
The comparison supports the view that Tajikistan and Kyrgyzstan have experienced larger degrees of
volatility and worsening levels of welfare
during the transition period
than other countries of EurAsEC.
We estimate a cross country OLS regression model in the following way:
SWIi = β0 + β1 Tri.+ β2 GGDi + β3
FDIi ++ β4 LPi εi (3)
Where i = 1,…,N and N is the number of countries that enter the
sample;
Independent Variables represent Integration.
-
Tr
is a trade terms ratio between
Export and Import ;
-
GGD – General Government Debt ;
-
FDI – Foreign Direct Investment
-
LP – Labor Productivity
The error terms εi are assumed to be uncorrelated with zero
mean and Var( εi) = σ2 .
After substantial testing using the variables , the regression results
show some preferred model which are
presented in table 1.
Table 1 – OLS Regression results
for 6 members of EurAsEC for the
period 1992-2008
Dependent variable: swi
Robust (HAC) standard errors
|
|
Coefficient |
Std. Error |
t-ratio |
p-value |
|
|
const |
0.611844 |
0.022225 |
27.5295 |
<0.00001 |
*** |
|
labour_producti |
1.02457e-05 |
2.2636e-06 |
4.5263 |
0.00002 |
*** |
|
trade_ration |
0.0236366 |
0.0160336 |
1.4742 |
0.14384 |
|
|
ggd |
-0.000297371 |
0.000131902 |
-2.2545 |
0.02654 |
** |
|
fdi |
-0.00166177 |
0.000919636 |
-1.8070 |
0.07403 |
* |
|
Mean dependent var |
0.698938 |
|
S.D. dependent var |
0.145448 |
|
Sum squared resid |
0.139523 |
|
S.E. of regression |
0.038943 |
|
R-squared |
0.934700 |
|
Adjusted R-squared |
0.928312 |
|
F(9, 92) |
146.3212 |
|
P-value(F) |
1.63e-50 |
|
Log-likelihood |
191.5878 |
|
Akaike criterion |
-363.1757 |
|
Schwarz criterion |
-336.9259 |
|
Hannan-Quinn |
-352.5462 |
|
rho |
0.374689 |
|
Durbin-Watson |
0.815283 |
Test for differing group intercepts -
Null hypothesis: The groups have a common intercept
Test statistic: F(5, 92) = 91.6107
with p-value = P(F(5, 92) > 91.6107) = 3.52467e-034
Specification of the Model explains SWI as linear combination of
the export / import ratio (trade
relationship), the general government
debt (public policy instrument), the foreign direct investment stock as a percentage of GDP , labour productivity . This model suggest positive correlation between labour productivity and social
development, negative correlation between GGD, FDI and social welfare of the
country and insignificant effect of
trade openness and social welfare.
The results need further tests to check their
robustness.