The
DNA polymorphism analysed according to the
RAPD-PCR method
and
useful characteristics of hens
Magdalena
Maria Gryzińska
Department of
Biological Basis of Animal Production,
University of Life Sciences in Lublin, 13 Akademicka Street, 20-950
Lublin
An academic
study financed from the research fund for 2005-2008, as research project no. 2
PO6Z 28
Classic gene
mapping developed very slowly. This status quo lasted until advanced techniques
of molecular biology and cytogenetics
were devised. They enabled the identification of new groups of genetic
markers that were exceptionally useful in mammal genome mapping [18]. DNA
techniques are still being perfected, which creates new possibilities for a
quick elaboration of complete genome maps of the eukaryotic genome. The chief
aim in mapping the animal genome is to identify the location and distances
between genes in chromosomes, as well as to search for genetic markers which
constitute distinguishing features of genes and determine their useful
characteristics. Another stage in animal genome mapping is the identification
of the main genes which condition economically vital quantitative
characteristics [21].
Hens are considered to be
good objects in the elaboration of genetic maps owing to a short interval between
their generations and the possibility to generate a significant number of
related offspring at the same time and in the same environmental conditions. Of
importance is also the accessibility of a considerable amount of DNA which can
be obtained from lymphocytes and nuclear erythrocytes
[18]. The hen genome consists of 39 chromosome pairs that are made up of
8 pairs of macrochromosomes, one pair of sex chromosomes (Z and W), as well as
30 pairs of microchromosomes [5, 6], which amounts to between 30 and 50
thousand genes [8]. At present, the hen genome map includes 135 loci, out of
which 35 are located in the 8 large autosomal chromosomes and sex chromosomes.
An international cooperation has been initiated to elaborate molecular maps of
the hen genome by using two verified populations for this purpose. The
presentation of an international stripe pattern of the hen karyotype and a
facilitation of its genetic mapping is impossible due to the lack of techniques to identify chromosomes and
microchromosomes (n = 29 + 8 + 2) [18, 20]. Particular difficulty in
assigning respective genes to
microchromosomes is presented by the lack of a model of the hen karyotype [18].
The first hen chromosome map which showed the position of 7 genes in a sex
chromosome and 11 ones in four autosomal conjugated groups was published by
Hutt in 1936. At the onset of the nineties the first international programs to
generate marker genome maps of other farm animals were created.
The use of DNA markers is
one of the most effective applications of the molecular biology techniques
[20]. RAPD has found multiple practical uses in poultry breeding. All over the
world research is conducted on the uses of RAPD markers and the determination
of diversity in genetic similarities, genetic variability and polymorphism [1,
14]. Sharma et al. conducted research which required the use of RAPD markers in
order to detect polymorphism between two hen populations: Aseel and Kadaknath
and to assess genetic diversity between them [15]. Levin et al. used RAPD in
order to create the genetic map of the hen Z chromosome. RAPD markers are
widespread in the whole Z chromosome and are likely to affect the majority or
all the characteristics contained in this chromosome [10]. An appraisal of the
genetic similarity of eight parental flocks based on the RAPD-PCR methodology
was also performed by Bednarczyk et al. [3], as well as by A. Okumus i M. Kaya
[13]. The former isolated DNA from blood drawn from the alar veins of 25
randomly selected adult hens from each group. The reaction was performed using
three different 10-nucleotide starters. 126 stripes were obtained. 8
monomorphic products with the molecular mass of 316-883 base pairs were
identified. A considerable polymorphism of the remaining amplification products
was also determined.
The RAPD analysis was
performed on Polbar hens. The variety was created by crossbreeding Greenleg
hens with Plymouth Rocks. The Polbar hen is an autosexing breed, which
constitutes its most important characteristic.
The aim of the research
was to determine the interrelation between phenotypic DNA forms identified by
the RAPD method and selected useful characteristics of Polbar hens.
THE MATERIAL AND
METHODS
The material for
analysis was provided in the form of blood drawn form the alar veins of 50
Polbar hens bred in the Laura Kaufman Didactic and Small Animal Research
Station which belongs to the Department of Biological Basis of Animal
Production of the University of Life Sciences in Lublin, as well as in the form
of records of useful characteristics in hens between the 28 and 33 week of
life. The blood was collected in sterile Vacuette test tubes with 4 mL of
Medlab Products blood containing the EDTA-K2 anticoagulant in the
proportion of 1,8 g of EDTA in 1 mL of the blood.
DNA isolation from complete blood was
performed with the DNA Isolation Kit from 0.1 – 1 mL of fresh blood, 0.1 mL of
frozen blood and with the Kucharczyk Blood DNA Prep Plus from blood traces,
allowing for modifications such as reducing the blood volume to 50mL and refilling to the volume of 100mL with the TRIS buffer solution. 1.5 mL test tubes were filled
successively with: 50mL of
the TRIS buffer solution, 200mL of the LT solution, 50mL of the blood and 20mL of proteinase K.
The isolated DNA was
amplified according to the RAPD-PCR method. Proglio starters were used in the
reaction. The volume of the assayed material was 25mL, i.e. 20mL of
the mixture and 5mL of
the DNA matrix.
The reaction mixture prepared for 10 assays consisted of: H2O
- 87,5mL;
QIAGEN PCR Buffer - 25mL; Q-Solution - 37,5mL; MgCl2 - 37,5mL; dNTP Mix - 10mL;
primer 1 ABI-01 – 5’gTTTCgCTCC3’ - 2mL; primer 2 ABI-05 – 5’
TgCgCCCTTg3’ - 2mL;
Taq polymerase - 2,5mL.
The RAPD-PCR reaction was
performed in the MJ Research PTC thermocycler – 225 Peltier Thermal Cycler. In
the following customized program a thermal profile was used that lasted 4h 46
min and began with a preliminary denaturation of bifilar DNA carried out at the
temperature of 94°C
and lasting 5 minutes.
Next, a repeating program was employed that consisted of 46 cycles, each
of which was composed of three stages: a 1 minute denaturation at 94°C; the starter addition at 36°C for 2 minutes; a 1 minute elongation at 72°C. The program was completed by: a 10 minute cycle at 72°C and the final one running until the end at 4°C.
After amplification the
experimental product was split up using electrophoresis on 1,8% Fermentas
agarose gel – TopVision™ LE GQ Agarose, with an addition of ethidium bromide:
10mL of ethidium bromide in 100 mL of the agarose
gel. Marking with ethidium bromide as the intercalating substance consists in
its photoactivation with light whose wavelength is 302 nm. The molecular mass
benchmark was the Fermentas GeneRuler™ 50bp DNA Ladder marker which contained
thirteen visible fragments with the following lengths: 50, 100, 150, 200, 250,
300, 400, 500, 600, 700, 800, 900 and 1031 base pairs. On the gel were placed
the 25mL DNA
samples mixed with 2mL of
a loading buffer which consisted of a 30% glycerol solution and bromophenol
blue. Apart from the samples the gel was also covered with the marker.
The electrophoresis was
performed in a TBE buffer onboard BIORAD Sub-cell ® GT at the
voltage of 80V for 210 minutes. Data backup was made using the CCD system.
Scion Image was used as the processing program.
The research documentation
was made up of the photos of the gel on which the electrophoretic splitting
took place. The analysis of the electrophoresis results was made using the
PopGen 32 Ver. 1.0 (Beta) software. A single allele chart was prepared for all
the analysed birds and then each individual bird was in turn compared with it
in order to determine the stripe pattern (phenotype). The names of the
phenotypes were determined depending on the number of stripes and their
spacing.
The farm documentation provided data on the useful characteristics of
the hens. The hens came from one brood. The
following characteristics were determined:
- the number of eggs laid in the period under analysis
- the weight of the eggs with the accuracy of 0.01g
The hens were divided into
groups depending on the phenotypic stripe pattern obtained in the RAPD-PCR
reaction. In such a group juxtaposition the mean values for a given
characteristic were compared using the Duncan test on the basis of one-way analysis of
variance.
THE RESULTS AND DISCUSSION
The isolated DNA was submitted to the RAPD-PCR
reaction. On the basis of the RAPD-PCR method it was concluded that a
polymorphism is present in Polbar hens. Stripes were identified in thirty three
birds, which amounts to 66% of those under analysis. The obtained DNA profiles
of the analysed birds are presented in the following electrophoregrams:
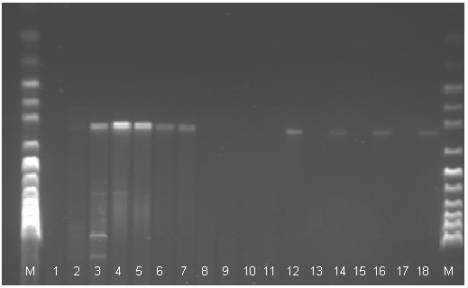
Fig 1. The electrophoregram of the DNA stripe patterns of the Polbar
hens according to the RAPD-PCR method. M: marker, 1-18: individual birds 1 to 18
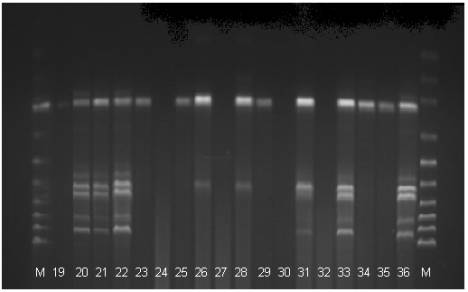
Fig 2. The electrophoregram of the DNA stripe patterns of the Polbar
hens according to the RAPD-PCR method. M: marker, 19-36: individual birds 19 to
36
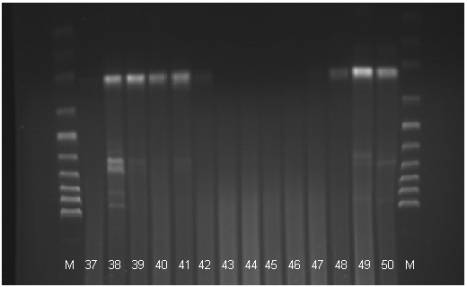
Fig 3. The electrophoregram of the DNA stripe patterns of the Polbar
hens according to the RAPD-PCR method. M: marker, 37-50: individual birds 37 to
50
The electrophoregram analysis
(Fig. 1) provided grounds for the identification of eighteen phenotypes: A –
one stripe is visible; B1, B2, B3 – two stripes; C1, C2, C3 – three stripes;
D1, D2 – four stripes; E1, E2 – five stripes; F – six stripes; G – nine
stripes; H- ten stripes; I1, I2 – eleven stripes, J – twelve stripes. In
seventeen cases the PCR reaction produced no effect.
The presence of between one
and twelve stripes at the height of between approximately 50 and 1000 base
pairs was observed (Tab. 1). In the case of all the birds in which
amplification took place a characteristic stripe was observed at the height of
300 base pairs. Similar conclusions
were arrived at by Wiśniewska et al. [12] who conducted research on a duck
population, as well as by Bednarczyk and Siwek
[3] in the case of hens and Wei et al. [19]. A close corelation was
observed between the identified phenotype and useful characteristics, the egg
weight in this case. The lack of amplification does not testify to poor useful
characteristics of the birds in which it was observed. On the contrary, in many
cases the hens laid a considerable number of eggs with the mean weight of 42,54
g. Although, as a rule, hens laying a large number of eggs are characterized by
a lower weight of their eggs and the other way round, the table shows that the
highest number of eggs which were at the same time the heaviest were laid by
birds belonging to the B1 phenotype, i.e. those with two stripes.
Table 1. The number of stripes and the identified Polbar hen phenotypes
determined on the basis of the analysis of the electrophoregrams obtained from
the RAPD-PCR reaction
|
Bird number
|
Stripe number
|
Identified phenotype
|
Bird number
|
Stripe number
|
Identified phenotype
|
|
1
|
no
|
-
|
26
|
3
|
C2
|
|
2
|
4
|
D1
|
27
|
no
|
-
|
|
3
|
5
|
E1
|
28
|
4
|
D2
|
|
4
|
2
|
B1
|
29
|
1
|
A
|
|
5
|
1
|
A
|
30
|
no
|
-
|
|
6
|
1
|
A
|
31
|
10
|
H
|
|
7
|
1
|
A
|
32
|
no
|
-
|
|
8
|
no
|
-
|
33
|
11
|
I1
|
|
9
|
no
|
-
|
34
|
2
|
B3
|
|
10
|
no
|
-
|
35
|
1
|
A
|
|
11
|
no
|
-
|
36
|
11
|
I2
|
|
12
|
2
|
B2
|
37
|
1
|
A
|
|
13
|
no
|
-
|
38
|
9
|
G
|
|
14
|
1
|
A
|
39
|
3
|
C3
|
|
15
|
no
|
-
|
40
|
1
|
A
|
|
16
|
1
|
A
|
41
|
3
|
C3
|
|
17
|
no
|
-
|
42
|
1
|
A
|
|
18
|
1
|
A
|
43
|
no
|
-
|
|
19
|
1
|
A
|
44
|
no
|
-
|
|
20
|
12
|
J
|
45
|
no
|
-
|
|
21
|
12
|
J
|
46
|
no
|
-
|
|
22
|
12
|
J
|
47
|
no
|
-
|
|
23
|
3
|
C1
|
48
|
1
|
A
|
|
24
|
no
|
-
|
49
|
6
|
F
|
|
25
|
1
|
A
|
50
|
5
|
E2
|
Table 2. The correlation between the phenotypes and useful
characteristics of the Polbar hens
|
Identified phenotype
|
Egg number
|
Mean weight of
an egg (g)
|
|
A
|
15,08
|
41,30b
|
|
B1
|
24,00
|
44,99a
|
|
C1
|
16,00
|
35,76b
|
|
C2
|
7,00
|
39,15c
|
|
C3
|
17,50
|
43,58a
|
|
D1
|
16,00
|
39,79a
|
|
D2
|
16,00
|
39,85c
|
|
E1
|
12,00
|
45,33a
|
|
E2
|
9,00
|
43,62b
|
|
F
|
1,00
|
43,70b
|
|
G
|
13,00
|
41,67
|
|
H
|
6,00
|
39,50c
|
|
I1
|
21,00
|
39,34b
|
|
I2
|
17,00
|
44,39a
|
|
J
|
15,00
|
40,47a
|
|
No
amplification
|
15,29
|
42,54b
|
a, b, c – the means marked with different letters exhibit a significant
statistical variance with P ≤ 0,05
Table 2 presents the means of the analysed useful characteristics in the
hens divided into groups depending on the identified phenotypes which were
determined according to the RAPD-PCR method. The Duncan test was performed on
the basis of one-way analysis of variance for the eighteen identified
phenotypes. Three groups containing the following phenotypes were singled out:
a) B1, C3, D1, E1,I2, J,
b) A, C1, E2, F, I1, X (no amplification),
c) C2, D2, H.
Statistically significant differences were observed
between the above identified three groups. The hens from the first group with
B1, C3, D1, E1, I2 and J phenotypes laid bigger eggs than the hens from the
other groups did, with the mean egg weight of 43,09g, whilst those from the
second group with A, C1, E2, F and I1 phenotypes, as well as those not
susceptible to amplification laid eggs that weighed 41,04 g on average. The
lightest eggs were laid by the hens from the third group that included C2, D2
and H phenotypes. The mean weight of eggs in this group amounted to
39,50 g.
Szwaczkowski et
al.[17] assessed the association of selected egg protein forms and the serum of
the N88 hen breed with its useful characteristics. In the research conducted
between 1995 and 1996 on 300 birds which came from the Laying Brood Hen Farm in
Rujsca the following protein genotypes were analysed: for prealbumins, albumins
(Alb), postalbumins (Paa), transferrine oraz pretransferrine (Ptf),
postransferrine (Potf), ovalbumin (Ov-a), ovoglobulins (G2, G3, G4) and
conalbumin (Co). In order to identify the protein genotypes an electrophoresis
was carried out on polyacrylamide gel. Useful characteristics taken into
consideration involved: the body weight, the egg weight, the sexual maturity
age, as well as the initial laying capability. Monomorphism was observed in the
following proteins: Alb, Paa, Ptf, Potf, Ov-a, G3 and Co. Similar research was
performed by Brodacki et al. [4] in
order to identify polymorphism and to determine the interrelation between the
polymorphic protein forms of the yolk and white of eggs and the body and egg
weight in Greenleg Partridge hens.
The obtained results confirmed that RAPD can be
employed in the role of a genetic marker in order to determine useful
characteristics of hens. The author`s research concerned the laying capability.
However, research was also done to analyse meat capabilities. Siwek and
Bednarczyk [3] did research using the RAPD-PCR method to evaluate the genetic
similarity of eight parental flocks of meat hens. According to the producer
they came from one and the same breeding stock. The DNA was isolated from blood
drawn from the alar veins of twenty five randomly selected mature hens from
each flock. In the PCR reaction 126 stripes were identified. Their number
ranged from three to ten depending on the starter used and the flock of birds.
The resultant eight monomorphic products with the molecular masses between 316
and 883 base pairs and a considerable polymorphism of the remaining
amplification products indicates a heterogenous origin of the bird flocks under
comparison.
The RAPD-PCR method was proved effective in assessing
the genetic diversity between five hen varieties [8]. The varieties were: the
Greenleg Partridge hen (Z11), the Yellowleg
Partridge hen (Ż33), the Leghorn (G99 and H22), the Rohde
Island Red (R11) and the Sussex (S66). Out of ten starters two were chosen.
They rendered different, repeatable amplifications and created a polymorphic
pattern in one or more varieties. The obtained results suggest the presence of
DNA polymorphism in the analysed hen varieties. Similar results in poultry were
obtained by Bednarczyk & Siwek [3], Smith et al. [16] and Wężyk
et al. [20]. The orientation, duration and intensity of selection resulted in
differences in the genotypic, quantitative and qualitative characteristics of
the hen varieties under analysis. The genetic diversity was affected by
breeding practices and the value of the similarity index can stem from the
common phylogenetic origin of the analysed hen varieties. The research showed
that both the Leghorn varieties (G99 i H22) do not have very close genetic
similarity. On the other hand, there is little genetic disparity between the
Z11 and Ż33 hen varieties. They stem from a common stock. The closest
genetic similarity is present in the R11 and S66 varieties which over several
generations were selected in the same direction and using the same method. The
employment of the RAPD-PCR method to determine the genetic diversity and
similarity proved exceptionally effective. The obtained results justify the
continuation of protection of the analysed genetic hen resources against
extinction.
In order to determine the DNA (RAPD) polymorphism of a
flock of the Japanese quail Gajewska [7] used 8 starters consisting of 10
nucleotides. Six of them produced PCR polymorphism. Depending on the applied
starter between 2 and 14 amplified matrix DNA fragments were obtained for a
single individual bird under analysis. The conclusion that the RAPD-PCR method
is effective in determining polymorphism in poultry was also arrived at by Horn
et al [9] who analysed DNA polymorphism in a geese population consisting of twenty
individual birds. In similar research performed on the White Leghorn Singh and
Sharma [24] also used twelve starters and observed a 22 % polymorphism. The
varieties used in the research were laying hen varieties. Mollah et al. also proved that RAPD markers
can be useful in determining polymorphism [12]. Out of 39 fragments amplified
with four starters 25 showed polymorphism. The number of observed stripes
ranged from 9 to 11. Wiśniewska et al. [21] performed a RAPD-PCR molecular
analysis in selected duck populations. The aim of the research was to provide
genetic profiles of the selected duck groups on the basis of an analysis of the
DNA polymorphism observed using the RAPD-PCR method. The molecular analysis of
the selected groups was based on the following parameters: the number of the
amplified DNA fragments counted, the number of stripes common for the profiles
under comparison in pairs and the PG factor. The mean genetic similarity was
within the range of between 0,68 and 0,78, which suggests a high level of
similarity between the analysed groups. Consequently, their common phylogenetic
origin can be assumed. Similar results were obtained in parallel studies of
domestic geese varieties. In these groups genetic similarity had the following
values: 0,71-0,80 [2] and 0,59-0,68
[11].
Amplification did not occur in 32% of the birds under
analysis. One stripe was observed in 28%, while two, three, four, five and six
stripes were identified in 22%, nine, ten, and eleven in 8% and twelve stripes
in 6% of the hens.
Table 3. The phenotypic diversity of Polbar hens on
the basis of electrophoregrams obtained with the RAPD-PCR method
|
Stripe
number
|
Bird number
|
% of
birds
|
Phenotype
number
|
|
No
amplification
|
16
|
32
|
1
|
|
1
|
14
|
28
|
1
|
|
2
|
3
|
6
|
3
|
|
3
|
4
|
8
|
3
|
|
4
|
2
|
4
|
2
|
|
5
|
2
|
4
|
2
|
|
6
|
1
|
2
|
1
|
|
9
|
1
|
2
|
1
|
|
10
|
1
|
2
|
1
|
|
11
|
2
|
4
|
2
|
|
12
|
3
|
6
|
1
|
|
Total
|
50
|
100
|
15
|
Birds with the
A genotype or those with one stripe are phenotypically identical since the
stripe was observed at the same height, i.e.
300 base pairs. Disparity in this respect was also not observed in birds
with the following numbers of stripes: six, nine, ten and twelve. Two different
phenotypes were observed in hens with four, five and six stripes. On the other
hand, the presence of three different phenotypes was observed in birds with two
and three stripes.
An analysis of genetic similarity was also performed
by Okumus A. and Kaya M. [13] who used twelve primers to identify it. The
research was carried out in the following hen populations: Rir I, Rir II,
Barred I, Barred II, Colombian Rock, Line-54, Blue Line, Maroon Line, Black
Line and Brown Line. Out of twelve primers nine amplified the DNA genome in ten
meat hen samples. 35 stripes were obtained. A polymorphism was identified in
42%. The greatest genetic similarity was detected between: the Barred I and the
Maroon (0, 3733) and the smallest between the Colombian Rock and the Barred II
(0, 0899).
CONCLUSION
The RAPD-PCR reaction product was observed in thirty
three birds, i.e. 66%. No amplification was observed in seventeen hens. On the
basis of the numbers (ranging from none to twelve) of stripes eighteen
phenotypes were identified.
A correlation was observed between the presence of
polymorphism identified by RAPD-PCR and the laying performance (the number of
eggs laid between the 28 and 33 week of life and the weight of those eggs) of
Polbar hens. The Duncan test was performed on the basis of one-way analysis of
variance for the eighteen identified phenotypes. Three groups containing the
following phenotypes were singled out:
a) B1, C3, D1, E1, I2,
J,
b) A, C1, E2, F, I1, X (no amplification),
c) C2, D2, H.
Statistically significant variance was identified for
the weight of eggs laid between the 28 and 33 week of life. The hens from the
first group with B1, C3, D1, E1, I2 and J phenotypes laid the biggest eggs with
the mean egg weight of 43,09g, whilst those from the second group with A, C1,
E2, F and I1 phenotypes, as well as those not susceptible to amplification laid
eggs that weighed 41,04 g on average. The lightest eggs were laid by the hens from
the third group that included C2, D2 and H phenotypes. The mean weight of eggs
in this group amounted to 39,50 g.
BIBLIOGRAPHY
1. Ali B.A., Mohamed
Ahmed M.M., Aly O.M., 2003, Relationship between genetic similarity and some
productive traits in local chicken strains. African Journal of Biotechnology,
22, 54-58.
2. Bednarczyk M.,
Siwek M., Mazanowski A., Czekalski P, 2002, DNA polymorphism in various goose
lines by RAPD-PCR. Folia Biol, Kraków 50, 45-48.
3. Bednarczyk M.,
Siwek M., 1999, Estimation of genetic relatedness among parental flocks of
meat-type hens from the same breeding group. Ann. Anim. Sci.-Rocz. Nauk. Zoot
4, 93-104.
4.
Brodacki A.,
Tarkowski J., Jędo A., Warszawa 2000, Polimorfizm białek
żółtka i białka jaja a masa ciała i masa jaja kur,
Prz. Hod. Zeszyty Naukowe 49.
5. Burt D. W., 2004,
The chicken genome and the developmental biologist. Mechanics Development 121,
1129-1135.
6. Emara M.G. and Kim
H., 2003, Genetic Markers and their Application in Poultry Breeding. Poultry
Science, 952-953.
7.
Gajewska M.,
1997, Analiza genetyczna stada przepiórki japońskiej oparta na
losowej amplifikacji DNA (RAPD). Prace i Materiały Zootechniczne, Zeszyt
Specjalny 7.
8. Hillel J., 2004,
Detection of production trait loci in the chicken genome. Animal Science Papers
and Reports, 89-93.
9. Horn P.L., Rafalski
J.A., Whitehead P.J., Molecular genetic (RAPD) analysis of breeding Magpie
Geese. Auk 113, 552-557.
10. Levin L., Lyman B. Crittenden
L.B., Dodgson J.B., 2002, Genetic Map of
the Chicken Z Chromosome
Using Random Amplified Polymorphic DNA
(RAPD) Markers.
11. Maciuszonek A., Grajewski B.,
Bednarczyk M., Kraków 2005, RAPD-PCR analysis of various goose
populations, 58.
12. Mollah M.B.R., Alam M.S.,
Islam F.B., Ali M.A., 2005, Effectiveness of
RAPD marker in generating polymorphism in different chicken
population. Biotechnology, 41, 73-75.
13. Okumus A., Kaya M, 2005,
Genetic similarity by RAPD between pure lines of chicken. Journal of biological
sciences 5 (4), 424-426.
14. Sharma A.K., Singh R.K., Kumar
S., Sharma D., 2001, Genetic relatedness among chicken breeds using randomly
amplified polymorphic DNA (RAPD) markers. Indian Journal of Animal Sciences ,
71 10 , 941-945.
15. Sharma D., Singh D.P., Singh
R.V., 2000, Polymorphism in Indigenous Poultry Germplasm Detected through
randomly Amplified Polymorphic DNA. Journal of Applied Animal Research, 18
1, 115-120.
16. Smith E.J., Jones C.P.,
Bartlett J., Nestor K.E., 1996, Use of Randomly Amplified Polymorphic DNA
markers for the genetic analysis of relatedness and diversity in chickens and
Turkeys. Poultry Science, 579-584.
17.
Szwaczkowski T.,
Brodacki A., Szydłowski M., Warszawa 1997, Ocena zależności
między genotypami białek surowicy krwi i jaja a cechami
użytkowymi kur nieśnych. Przegląd Hodowlany, Zeszyty Naukowe 32,
Chów i hodowla drobiu.
18.
Wardęcka
B., Olszewski R., Jaszczak K., 2000,
Mapowanie genomu kury. Prace i Materiały Zootechniczne 57.
19.
Wei R., Dentine M.R., Bitgood J.J, 1997, Random amplified polymorphic
DNA markers in crosses between inbred lines of Rhode Island Red and White
Leghorn chickens. Animal
Genetics, 28, 291-294.
20.
Wężyk
S., Cywa- Benko K., Bednarczyk M., Siwek M., Krawczyk J., 1999, Biotechnologia w hodowli drobiu.
Postępy Nauk Rolniczych 1, 81-92.
21.
Wiśniewska
E., Grajewski B., Bednarczyk M,2005, Charakterystyka wybranych populacji kaczek
metodą RAPD-PCR. Medycyna Wet., 61 (12).