Martynov
V. L., Candidate of Technical Sciences, Associate Professor
Kremenchuk
Mykhaylo Ostrogradsky National University, Ukraine
The
definition of optimal proportions for blocked mansard energy efficient dwelling
houses
Abstract. The method of definition of
optimal and rational proportions for energy efficient mansard dwelling houses by
blocking in regard to heat loss through protecting structure has been
suggested.
Key words. Energy efficient mansard
dwelling houses, geometric simulation, optimal proportions, blocking of the
houses, squared shape of designs, architectural design.
Formulation of the problem. While planning the energy
efficient mansard house, the problem of heat loss reduction due to protection
structures appears. One of the methods for heat loss reductions is matching the
optimal proportions in regard to the protecting structure and blocking of the
houses. It provides a substantial reduction of heat loss (up to 25 per cents).
The analysis of previous researches. In the research [1] the shape of body of
deflected position that provides minimal heat exchange with closely set heat
source has been determined. In the paper [2] the optimal proportions of the
house with its planning in squared shape depending on thermal resistance of the
walls, ceiling and floor have been calculated.
In the paper [3]
the optimal proportions for the house with squared shape planning have been
defined. However, blocking of the house was not taking into account.
In the studies [4,
5] the optimal proportions of the house with squared shape planning, round
shape, regular hexagon, octagon planning have been determined. Thus, the
opportunity of house blocking was not taken into account.
Problem
statement. To suggest the method of the definition of optimal and rational
proportions for mansard energy efficient dwelling houses by blocking (taking
into account the supplemental indices).
The main part. In order to determine the optimal proportions of mansard houses (squared
shape of designs) concerning heat loss, the formulae have been deduced which express
the relation of optimal proportions
(side a) on the house cubic
capacity V, an average heat transfer resistance of protecting structures (walls
Rwalls average, the ceiling R ceiling average, the windows R windows average,
the roof R roof average, an average coefficient of the floor R floor
), the number of floors in the house Nfloor, the correlation of
the square of windows glassing to square of the floor of the storey
(coefficient F), angle of slope of a house ceiling to the horizon square (angle
α), rate (level) of blocking of the house side Gi, coefficient
of windows glassing P (from 0 to 1).
One of the most distributed forms of mansard house
planning is rectangle, where one side is a,
and the other – a*m (Figures 1, 2, 3).
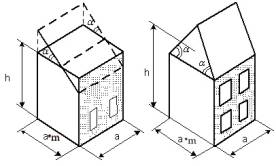
Figure 1 Figure 2 Figure
3
For mansard houses with
squared shape form of designs, where one side is a, and the other – a*m, the optimal proportions are defined (Figure
1, 2, 3).
Side a can be defined as
a =  (1)
(1)
where m is correlation of
sides in the design.
The height of a house h is defined as
 . (2)
. (2)
If, for a certain case, the
average resistance to heat loss of next walls is differ, and the percentage of
windows situated in the walls is
different, in a formula, it can be
expressed by
 . (3)
. (3)
D1=
m (4)
(4)
The height of a house h is defined
as
 . (5)
. (5)
During
complete blocking by one side (Figure 4, 5), the side a is defined as
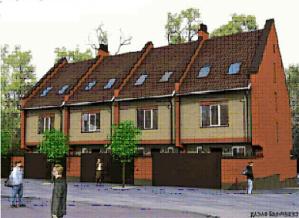
Figure 4 Figure 5
a =  . (6)
. (6)
D2= . (7)
. (7)
The height of a house is defined by the formula (5).
During the complete blocking by two sides (Figures 5, 6), side a is defined as
Figure 6
a =  . (8)
. (8)
The height of a house h is defined by the formula (8).
During the partial blocking by
one side (Figures 7, 8), the formula of optimal proportions definition can be
expressed by
Figure 7 Figure 8
The formula for calculations has been defined. The variable side a is defined as
a =  (9)
(9)
D3= (10)
(10)
The height of the house is
defined by the formula (5).
The coefficient of houses side blocking Gi is defined as
Gi= ![]() .
(11)
.
(11)
During partial blocking by two
sides, the formula of the definition of the optimal proportions can be expressed
as follows (Figure 9).
Variable side a is defined as
Figure 9
а =
 . (12)
D4= .
(13)
.
(13)
The height of a
house h is defined by the formula
(8).
Thus, it is often impossible
to use optimal proportions of the house in practice of planning. It can be connected
to the application of standard size of the longitudinal girder, construction
elements, floor height, house function, the possibility of proportions matching
in regard to visual expressiveness etc. Since, there is a problem of rational
proportions development for a house (approximate to optimal proportions).
In order to solve
the problem, the special complex of geometric models has been worked out which allows
the architect - designer by means of interactive dialogue regime projector ECM
to find:
-
optimal proportions of a house;
-
rational proportions of a house (heat loss for specified level of
percentage exceeds the optimal proportions);
-
to determine the limits of possible variation of house proportions etc.
Having programmed the outgoing data, the surface models simultaneously
are being designed on the terminal of display:
- ![]() by
by ![]() ,
, ![]() ,
, ![]() , they are modeling :
, they are modeling :
- ![]() - heat losses of the house with specified cubic
capacity V with determined outgoing data
R ceiling average , R floor
average, R window average, Nfloor, F, R roof average ;
- heat losses of the house with specified cubic
capacity V with determined outgoing data
R ceiling average , R floor
average, R window average, Nfloor, F, R roof average ;
- ![]() - the diagram is modeling the necessary specified
level of house heat loss (some percents are higher than optimal level);
- the diagram is modeling the necessary specified
level of house heat loss (some percents are higher than optimal level);
- ![]() - the two-dimensional model which shows the
dependence of the house height on house
side a according to the given cubic capacity V.
- the two-dimensional model which shows the
dependence of the house height on house
side a according to the given cubic capacity V.
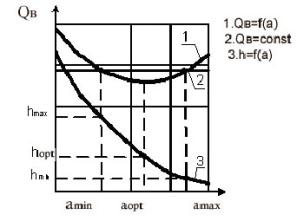
The
intersection of models and (Figure 10) defines
an area of variation by the value of house side from аmin to аmax. Knowing аmin and аmax with the use of a model h = f (а), the
area of variation by the value of house height
hmin ...hmax
is defined.
 The
following models are designed on display terminal; they are estimated and
printed out by a designer.
The
following models are designed on display terminal; they are estimated and
printed out by a designer.
Conclusion. The method of definition
of optimal and rational proportions for mansard energy efficient dwelling
houses by their blocking taking into account the supplemental indices (average
heat transfer resistance of protecting constructions, the level of house
blocking Gi etc.) has been
worked out. Figure 10
Literature
1. Сергійчук О.В.
Форма тіла, що забезпечує мінімальний теплообмін при близько розташованому
джерелі тепла // Прикл. геометрія та інж. графіка: Між від.наук.-техн.зб. –
К.:КНУБА, 2005. - Вип.75. – С. 105-111.
2. Маркус Т.А., Морис
Э.Н. Здания, климат и энергия. - Л.:
Гидро- метеоиздат, 1985. –
540 с.
3. Беляев
В.С., Хохлова П.П. Пpоектиpование энеpгоэкономичных и энеpгоактивных
гpажданских зданий.- М.: Высш. шк., 1991.- 255 с.
4. Мартинов В. Л. До питання визначення
оптимальних та раціональних пропорцій енергоактивних житлових будинків при
різних формах планів / В. Л. Мартинов // Сб. науч.
трудов Киевского национального университета технологий и дизайна (спецвыпуск) :
геометрич. и компьют. моделирование :
энергосбережение, экология, дизайн : доклады 1-й Крымской науч.-практ.
конференции, Симферополь-Новый Свет, 22-26 сент. 2004 г. ― К. : Випол,
2004. ― С. 166-170.
5. Мартинов В.Л.
Геометричне моделювання параметрів енергоактивних житлових будинків//Матеріали VI Міжнародної науково-практичної
конференції «Геометрическое моделирование и компьютерные технологи: теорія,
практика, образование». Харьков, 2009. - С.153-158.
Information
about author
Martynov Vyacheslav Leonidovych
Candidate of Technical Sciences
Associate Professor
Kremenchuk Mykhaylo Ostrogradsky
National University, Ukraine
Head of department “Engineering and Computer Graphics”
39600
Poltava region
Town of Kremenchuk
Pershotravneva 20, room 1506
Kremenchuk Mykhaylo Ostrogradsky
National University, Ukraine
Departmeant “Engineering and
Computer Graphics”
tel. +38 (0536) 74-33-08, +38(066) 8431774