Экономические науки/8.
Математические методы в экономике
Serkebayeva L.T
A.Baitursynov Kostanai State University, Kazakhstan
Technology for solving optimization
problems.
In solving the economic problems
often raises the question of choosing the best option solutions. In other
words, we want to solve the optimization problem, which consists in choosing
the best solution among many possible options.
The optimization can be achieved by
setting the mathematical modeling of economic and social systems. The
optimization problem can be formulated in the language of mathematics: many
available options are described using mathematical relationships (equalities,
inequalities, equations) and each decision is assessed quantitatively using the
indicator. This figure is called the objective function. Then the best solution
is the one that delivers the objective function maximum or minimum value. The
direction of the objective function depends on the meaning of the problem.
- there is only one
target to optimize;
- there are
limitations recorded in the form of inequalities;
- a set of input
values.
Options are limited to those limit values:
-
the number of unknowns -
200;
-
the number of restrictions on the unknown – 100;
-
number of conditions on the unknown - 400.
The algorithm for finding
optimal solutions includes several stages:
-
preparatory work;
-
debugging solutions;
-
analysis solutions.
The sequence of preparatory work carried out in solving economic and
mathematical modeling using MS Excel is shown in Figure 1.
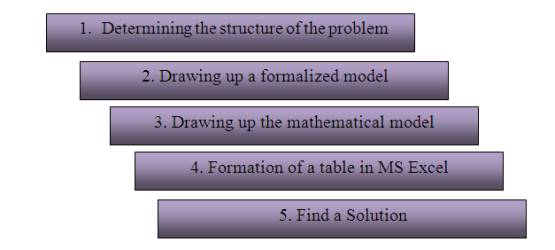
Figure 1. The scheme of the
preparatory work
Table 1
|
|
В |
С |
cost |
|
|
Weight unit of food I |
4 |
3 |
1 |
20 |
|
Weight unit of food II |
3 |
2 |
1 |
20 |
|
Weight unit of food III |
2 |
1 |
2 |
10 |
It
takes up the least expensive diet in which every animal would get the necessary
nutrients A, B, C.
Adding
data to a spreadsheet for further solutions using the tool "Search for
solutions" can be adjusted as follows (Figure 2).
By the
"Data - Search solutions" to open the window "Search for
Solutions" (Figure 3).
After
obtaining the optimal solution is carried out its analysis.
The
analysis of the optimal solution is the final stage of mathematical modeling of
economic processes.
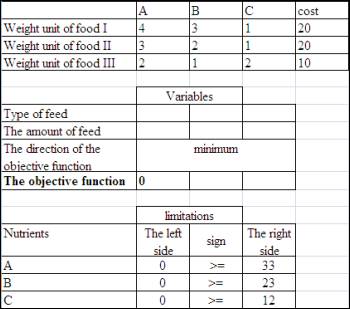
Figure 2. Making the data in
the table MS Excel.

Figure 3. Filling the tool
window " Search for Solutions"
It allows for a more accurate
check of conformity to the model of economic processes. Вut it does not
exclude or replace the traditional analysis of the plan from the economic
perspective before making management decisions.
Literature:
1.
В.Н.Пакулин. Решение
задач оптимизации управления в MS Excel 2010
2.
Тарасенко Н.В.,
Шеломенцева Н.Н. Математика-2. Решение задач оптимизации в Excel: Метод. указ. для студентов экономических
специальностей. – Иркутск: Изд-во
БГУЭП, 2003. – 43с.