Экономические науки/8. Математические методы в экономике
Abatov N.T, candidate of physical and mathematical
sciences, docent
A.Baitursynov Kostanai State University, Kazakhstan
Analysis of the statistical population means
Microsoft Excel
Summarized aggregate statistics are calculated on the basis of analysis
of variational series of distribution, time series. However, the package
Microsoft Excel allows you to calculate many of these parameters directly from
the raw data observations using the tools available add-ins "data
analysis", as well as statistical functions of the instrument
"Function Wizard".
Add-in "Analysis of Data" command is called "Data
Analysis" menu "Data" and contains in its structure such
aggregate statistical analysis tools: variance analysis, ANOVA with
repetitions, ANOVA without repetition, correlation, covariance, descriptive
Statistics, exponential Smoothing, moving average, Rank and Percentile, bar
chart, regression, sampling and other.
Window add-in "Analysis of Data" is shown in Picture 1.
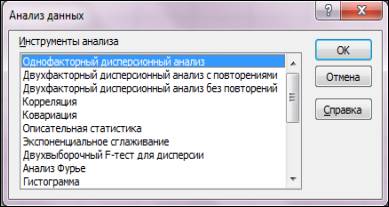
Picture
1 – Window "Data Analysis"
Consider, for example, how to use an instrument for the
"Descriptive Statistics".
Descriptive statistics is a
tool for the statistical description of the data representing the entire
observed population as a whole.
The purpose of descriptive
statistics - getting the summary (summarizing) indicators of the original data
set as a general (and not as a sample of some other set of larger size).
For the numerical evaluation
of general indicators together, so-called descriptive statistics, which are
single-valued functions on a set of observed data, determine the value of the
estimated aggregate indicators together.
Descriptive statistics are
calculated for non-grouped data and implement the exact functional dependence
of the values of indicators on the input data.
The indicators are calculated
using descriptive statistics can be divided into 3 groups - performance options
positions of characteristic values, characteristic variations and
features of the shape of its distribution.
The dialog box tool
"Descriptive Statistics" invoke a command add "Data
Analysis" menu "Data" and has a view that is displayed in
Picture 2
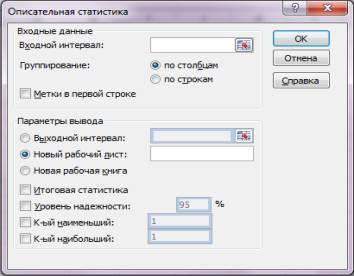
Picture 2 – The dialog box
tool "Descriptive Statistics"
The dialog box tool
"Descriptive Statistics" contains the following parameters:
1. The «Input interval» – Enter
link to the range of cells that contain the values of the
analyzed trait.
2. Switch "Grouping: by
columns / rows"– is set to a column or row, depending on the direction in
which the data are analyzed in the input range
3. Check "The labels in the first row"– is set to
active, if the first line in the input range contains the headers.
4. The "Output
Interval"– Enter link to the header cell of the first column productive
output tables.
5. Switches "New
worksheet" and "New Workbook"– installed in the active position
when the need to open a new worksheet, respectively, or a new book.
6. Check "Summary
statistics"– is set to active, if the input data necessary to calculate
the range of key indicators.
7. Check "The level of
reliability"– is set to active, productive if the table should include the
line to assess the limit of sampling error with a given confidence level.
8. The flags "K-th
smallest and the K-th largest" – activated when the table must include
productive line, respectively, for the k-th smallest and the largest k-th
values of the elements in the sample.
The indicators can be
calculated for multiple rows of data in accordance with the specified input
range of cells.
Literature:
1.
Козлов,
А. Ю. Статистические функции MS Excel в экономико-статистических расчетах :
учеб. пособие для вузов / А. Ю. Козлов, В. С. Мхитарян, В. Ф. Шишов ; под ред.
проф. В. С. Мхитаряна. – М.:ЮНИТИ-ДАНА, 2003.
2. Макарова, Н. В. Статистика в Excel : учеб. пособие / Н. В. Макарова, В. Я. Трофимец. – М.: Финансы и статистика, 2002.