Shtabinskaya T.T.
Grodno State Medical University, Belarus
The
prognostic significance of the expression of angiogenic markers in low-grade
colon cancer in I-II stage of disease
Relatively favorable morphological features of
any tumor are low grade and early stage of the disease.However, the survival
rate of patients with the same morphological features is different. Purpose: to determine the value of angiogenic markers expression in I-II
stages of low-grade CRC for the prognosis of the disease.
Materials and methods:
21 cases of low-grade CRC I-II stage were investigated. The study was performed
on paraffin sections using antibodies to VEGFА, CD 105, MMP-2, Erk2, iNOS, TGF-β, NRP1, MMP-9 according to standard procedure [1]. Quantitation of
the level of expression was described in the previous article [2]. Statistical analysis was performed
using STATISTICA 10.0 (SNAXAR207F394425FA-Q).
Results: Statistically significant differences in the expression of markers of
angiogenesis in patients stage I, depending on the five-year adjusted
disease-free survival (AFS) haven’t been identified. In patients with stage II
disease were statistically significant differences in the expression of VEGFA, NRP1, iNOS, and TGF-β. Using ROC-analysis identified the split point for the five-year
prediction AFS depending on the level of stromal VEGFA expression (fig.1).
251658240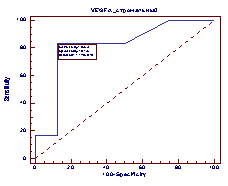
Figure 1 - ROC curve for the AFS prediction
in patients with stage II disease, depending on the level of stromal expression
VEGFA
The
area under the ROC-curve constructed through the analysis, equal to 0,81 ± 0,13
(the accuracy of the differences with the area under the diagonal = 0.017). The
most distant point from the diagonal to the ROC-curve corresponds to the level
of expression VEGFA equal to 0.978 (sensitivity - 83.3%, specificity - 87.5%).
The
area under the ROC-curve constructed through the analysis of the expression of
stromal NRP1, equal to 0,92 ± 0,08 (with the accuracy of the differences below
the diagonal area <0.0001) (fig.2). The most distant point from the diagonal
to the ROC-curve corresponds to the level of expression of NRP1 equal to 0.747
(sensitivity - 100%, specificity - 75%).
251658240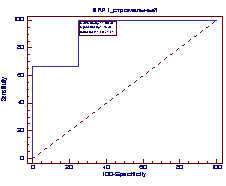
Figure 2 - ROC curve for the AFS prediction
in patients with stage II disease, depending on the level of stromal expression
NRP1
The
area under the ROC-curve constructed through the analysis of parenchymal TGF-β expression is equal to 0,98 ± 0,03 (the accuracy of the differences
with the area under the diagonal <0.0001) (fig.3). The most distant point
from the diagonal to the ROC-curve corresponds to the expression of TGF-β equal to 0.682 (sensitivity - 100%, specificity - 85.7%).
The
area under the ROC-curve constructed through the analysis of the general
expression of iNOS, equal to 0,84 ± 0,11 (the accuracy of the differences with
the area under the diagonal = 0.0013) (fig.4). The most distant point from the
diagonal to the ROC-curve corresponds to expression of iNOS is 0.69
(sensitivity - 83.3%, specificity - 75%).
251658240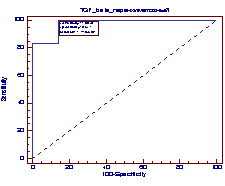
Figure 3 - ROC curve for the AFS prediction
in patients with stage II disease, depending on the level of parenchymal
expression of TGF-β
251658240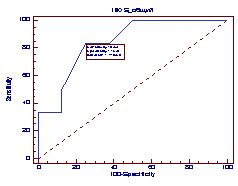
Figure 4 - ROC curve for the AFS prediction
in patients with stage II disease, depending on the level of general expression
of iNOS
Conclusion: Favorable
outcome (survival rate of more than 5 years), low-grade colon cancer in the II
stage predict when stromal expression VEGF≤0.978, parenchymal - TGF-β≤0.682, stromal - NRP1> 0.747, general - iNOS≤0.69.
Literature:
1. Коржевский, Д.Э. Основы
гистологической техники / Д.Э. Коржевский, А.В. Гиляров. – Спб.: СпецЛит, 2010.
– 95 с.
2.
Штабинская,
Т.Т. Прогностическое значение уровня экспрессии фактора роста эндотелия сосудов
в колоректальном раке / Т.Т. Штабинская [и др.] // Научно-практический журнал
УО «Гродненский государственный медицинский университет». – 2015. - № 3(51). -
С. 64-69.