Lavrenjuk А., Chernetchenko D.,
Botsva N., Pustova K.
Oles Honchar Dnipro National University, Ukraine
Blood pressure
monitoring
Blood pressure in the arteries - one of the main
indicators of the cardiovascular system. Persistently raised blood pressure is
one of the major risk factors for diseases such as myocardial infarction and
stroke. Uncontrolled hypertension is also associated with high rates of
mortality, particularly in middle and high-income countries [1]. Therefore, equipment
for measuring blood pressure parameters is a part of practically all modern
multichannel monitor systems.
There are several methods for measuring blood
pressure, which include palpation, arterial tonometry, Doppler, auscultation,
oscillometry and plethysmography. Non-invasive monitors with
combination of auscultative and oscillometric channels allows the
implementation of flexible algorithms for determining the parameters of
arterial pressure – values of systolic, diastolic, and mean pressure, and thus
improve the accuracy and reliability of measurements. The search for simple,
non-invasive and informative tests is a key step to predict the risk of
complications and progression of cardiovascular disease.
One of the important morphological characteristics of
the vessels is the rigidity of the vascular wall, which is mainly measured by
the velocity of the pulse wave propagation. This method, proposed in the
1950's, is undergoing a revival, due to the development of a new generation of
devices integrated with computer systems [2,3].
To determine the propagation velocity of a pulse wave,
the Moens–Korteweg equation is used:

E – the elastic modulus of the vessel wall, h – the wall thickness of the vessel; d – the diameter of the vessel, p – the density of the blood.
With increasing
rigidity E vessels, increasing the
thickness of its walls and with a decrease in diameter, the velocity of the
pulse wave increases. Also, the degradation of vessels walls ways to decreasing
pulse wave velocity variability during systolic and diastolic cycles. The
frequency and duration of the pulse wave depends on the characteristics of the
heart, and the magnitude and shape of its peaks – on the state of the vascular
system.
The form of pulse oscillations and their
characteristics reflect the work of the heart and the state of the vascular
system, therefore, their registration in different parts of the vascular system
and further analysis have a diagnostic value.
The beginning of systole occurs earlier than the
beginning of an increase in blood flow to the investigated area of the vessel.
Need some time Δt for
proliferation of the pressure wave on the vascular system. Using the anatomical
distance (L) from the heart to the
area under study, the wave propagation velocity can be calculated:
![]()
At any point in the vascular system, blood pressure
can be defined as:
![]()
P0 – the atmospheric pressure (in the right atrium); pgh – the hydrostatic pressure; R
- the pressure created by the heart.
To obtain raw data for further processing and
determination of pressure parameters, it is necessary to measure pressure by a
mechanical tonometer at the beginning of the experiment and at the end. The
next step is the synchronous measurement of the electrocardiogram and pulse
rate and processing of the obtained data using the Matlab software package.
Using the original program code data collected and processed.
After recording the ECG and heart rate, the delay
between the R peaks of the ECG and
the maximum slope of the pulse wave is considered; it allows to obtain the
propagation time of the pulse wave equal to the value of pulse transit time (PTT).
The calculations also use the approximate distance of the vessels from the
heart to the wrist equal to half the height value. With PTT and the length of
the vessels, it is possible to calculate the speed of the pulse wave
propagation (Fig.1), and then from the Moens–Korteweg equation we can find the
relationship between wave propagation and arterial pressure and obtain numerical
values for systolic and diastolic pressure.
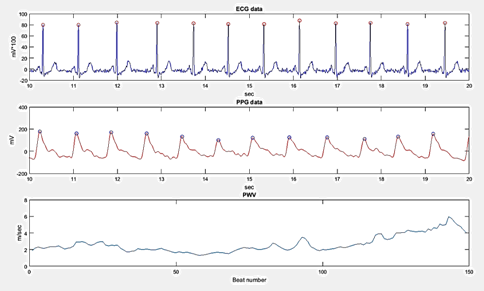
Fig. 1. ECG, pulse and wave propagation velocity: the upper
chart – electrocardiographic data, average one- the pulse rate (synchronized
with ECG),
the lower one – rate of pulse wave propagation.
In order to calculate the pressure factors more
accurately, it is necessary to conduct a series of measurements for different
people and in different states. Based on this, can obtain compliance for
systolic and diastolic pressure and teach the program to recalculate values and
output data almost instantly.
The results of the work can be useful in carrying out
automated medical and biological research.
References
1.
Manzella D., Grella R. et all. Blood
pressure and cardiac autonomic nervous system in obese type 2 diabetic patients:
effect of metformin administration // American
Journal of Hypertension. 2004. 17(3),
223–227.
2.
H'juston
M. Sosudistaja biologija v klinicheskoj praktike. – L'vov, 2007.
3.
Radchenko,
G.D. Vpliv trivaloї kombіnovanoї antigіpertenzivnoї terapії na zhorstkіst'
arterіj elastichnogo ta m’jazovogo tipіv u pacієntіv z tjazhkoju arterіal'noju
gіpertenzієju/G.D. Radchenko i dr.//Ukraїns'kij kardіologіchnij zhurnal. 2009. 2, 109–128.