P.h.D. Kryuchin
O.V., Kryuchina E.I.
Tambov State University
named after G.R. Derzhavin
Forecasting the currency exchange rates
using technical analysis and artificial neural
networks
As we know the
currency exchange rates system condition is characterized by time series ![]() . For simulating
the time series it is necessary to discover the function
. For simulating
the time series it is necessary to discover the function ![]() . The flavor of
function
. The flavor of
function ![]() is unknown so in simulation this function is
changed to approximate function F which is defined for minimum
difference between empirical currency
is unknown so in simulation this function is
changed to approximate function F which is defined for minimum
difference between empirical currency ![]() and forecast currency
and forecast currency ![]() in equation
in equation ![]() . Here c is
discharging coefficient which defines the length of the forecasting period. So
the target of forecasting currency exchange rates is to detect the parameters F,
L and c by minimizing the value
. Here c is
discharging coefficient which defines the length of the forecasting period. So
the target of forecasting currency exchange rates is to detect the parameters F,
L and c by minimizing the value ![]() [1].
[1].
Artificial neural
networks (ANN) are actively used by institutional investors which work with a
large amount of information and which need to make allowances one currency to
other. The difference to technical analysis is the possibility to find optimal
factors and to use them in forecasting [2-3].
The aim of this
paper is to predict exchange rates between Euro and US dollar using an
artificial neural network and technical analysis. It needs to train ANN
structure witch consider time series of currency pair €/$ quotations, the check of ANN-model adequacy based on this structure,
the forecasting result of technical and neural networks analysis comparison and
to formulate a corollary about the possibility to use ANN for predication.
ANNs are
mathematical instruments which are computer models of biological neural
networks, which can be trained using log-normal observations and can be used
with information dearth or its noisiness. This instrument is very flexible and
this property allows to consider different log-normal red observations using
the change of structure and of manager parameters of model [4].
If technical
analysis is used, then the time series of quotations ![]() usually is broken into intervals. First and
last values of each interval are the open cost (
usually is broken into intervals. First and
last values of each interval are the open cost (![]() ) and close cost (
) and close cost (![]() ) and the highest (
) and the highest (![]() ) and the lowest (
) and the lowest (![]() ) within each
interval are defined.
) within each
interval are defined.
The most popular
tool of technical analysis is the moving average (MA) which calculates the mean
value of cost in a strict time interval. So this tool is method of smoothing of
cost factors which are cumulated for several periods. The MA can be calculated
for each serial data array such as open and close cost, maximum and minimum
quotations, trade size or value of other indicators (for example MA itself).
There are several
kinds of MA:
·
simple
MA ![]() ;
;
·
exponential
MA ![]() ;
;
·
smoothed
MA ![]() ;
;
Here ![]() ,
, ![]() are costs of open and close in time moment
are costs of open and close in time moment ![]() , m is the
length of smoothing period,
, m is the
length of smoothing period, ![]() is cost participate coefficient.
is cost participate coefficient.
An other used tool is a stochastic oscillator which builds two series. The first series values are calculated by formula
|
|
(1) |
and the second is the MA of first. Often
a third series is added which is MA of the second. The crossing of smoothed and
non-smoothed means changes the direction of the moment of the quotations. It
the smoothed curve crosses the non-smoothed curve from below means growing
start and othersize from above means growing end [5].
There are different
strategies of using the MA and the stochastic oscillator approach.
Best results of
forecasting of currency pair €/$ (Euro and US
dollar) were got using a stochastic oscillator with periods 5, 3 and 3.
Quotations values were calculated correctly with a probability of 0.65.
We will use two ANN
models. First of these it a multilayer perceptron (MLP) which is a structure in
which each neuron in each layer (except output layer) is connected to all
neurons of the next layer. Weight coefficients is are calculated by formula ![]() where NL is layers count,
where NL is layers count, ![]() is the number of neurons in i-th layer
[1]. The second structure is a Volterra network which is a dynamic network for
the nonlinear adaptation of array of signals belated for each other. The vector
is the number of neurons in i-th layer
[1]. The second structure is a Volterra network which is a dynamic network for
the nonlinear adaptation of array of signals belated for each other. The vector
![]() from equation
from equation  activates the network at moment m. This
polynomial degree is called the Volterra series degree [2].
activates the network at moment m. This
polynomial degree is called the Volterra series degree [2].
The testing consists of several steps:
·
the
algorithm starts at time t=t0, and sets the test index to k=0;
·
the
pattern is formed;
·
weight
coefficients are trained by a gradient algorithm of steepest descent [3];
·
the
input vector ![]() is formed and the ANN calculates the output
output value yN+1 ;
is formed and the ANN calculates the output
output value yN+1 ;
·
the
quotation change ![]() is calculated and used for calculation of
value
is calculated and used for calculation of
value 
·
the
time t is changed (t = t + c) and the test index is incremented (k
= k + 1);
·
the
algorithm goes to step 2.
These tests show the probability of obtaining the
correct direction of the quotation change. For multilayer perceptron it is 72%
and for a Volterra network it is 76%. The technical analysis allows to forecast
the direction of change with probability value of about 65%. So the neural
network analysis using a Volterra network is efficient.
Figure
1 shows series of currency pair quotations, both empirical and forecast ( by
the multilayer perceptron and the Volterra network).
It
follows from the experimented results that a Volterra ANN with four layers and
twelve inputs allows to predict the correct direction of the quotation change
with a probability of 76%. So such a structure can be used for forecasting of
exchange rates.
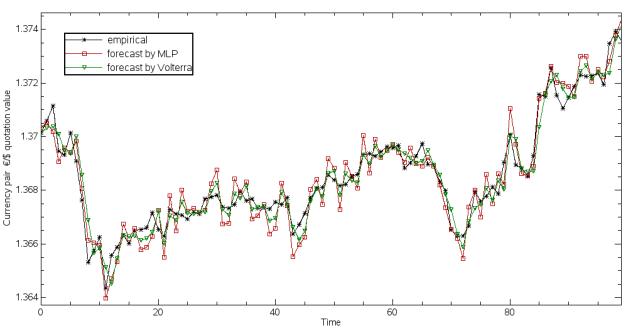 Pic.
1. Empirical exchange rates, exchange rates forecast by multilayer perceptron
and by Volterra.
Pic.
1. Empirical exchange rates, exchange rates forecast by multilayer perceptron
and by Volterra.
 (1)
(1)
Literature
1.
Кузнецов С.П. Динамический хаос. // Москва,
1994. – 274 с.
2.
Бэстенс Д.Э. ван ден Берг В.М. Вуд Д.
Нейронные сети и финансовые рынки: принятие решений в торговых операциях. //
Москва: ТВЦ. 1997. – 236 с.
3.
Вострокнутова. А.И. Модели прогнозирования
курсов акций российских нефтяных компаний // Извесия Санкт-Петербургского
университета экономики и финансов. \textnumero3), СПб. 2000. –
C. 126-144.
4.
Зенкова Н.А. Моделирование на основе
аппарата искусственных нейронных сетей как метод исследования в психологической
науке. // Вестн. Тамб. ун-та. Сер. Естеств. и техн. науки. Тамбов: 2009. Т. 14,
Вып. 3. – С. 577-591.
5. Osowsky S. Sieci
neuronowe w ujeciu algorytmicznym // Warszawa. 1996.
6.
Kryuchin O.V., Arzamastsev A.A., Troitzsch K.G. The
prediction of currency exchange rates using artificial neural networks [Электронный ресурс] — Электрон. дан. // Arbeitsberichte aus dem Fachbereich Informatik
Nr. 4/2011. Koblenz. 2011. 12
p. — http://www.uni-koblenz.de/%7Efb4reports/2011/2011_04_Arbeitsberichte.pdf