Technical science/2. Mechanics
Dr. Sc. Techn., professor Gots A. N.
Vladimir state University of a name Alexander
Grigorievich and Nikolai Grigorievich Stoletovs, Russia
New schematized diagram of limit cycles under the action of normal
stresses
Calculation
of factors of safety of machine parts under the action of normal stresses in
the case of uniaxial stress state and the asymmetric cycle of loading with
amplitude σa and mean stress σm is performed on the basis of dependency S. W.
Serensen, and R. S. Kinasoshvily [1]:
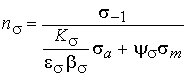 , (1)
, (1)
where Kσ is the effective stress concentration factor; εσ – scale
factor; βσ –
coefficient of the surface layer; ψσ –
coefficient of influence of cycle asymmetry or coefficient, which characterizes
the sensitivity of the material to the asymmetry of the cycle [2] .
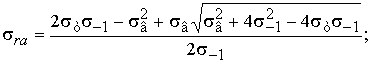
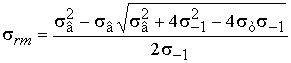
The
maximum amplitude of the stresses σra for laboratory sample
with asymmetric cycle of loading can be expressed by the equation, well the
corresponding experimental data in the range of variation of the coefficient of
asymmetry ![]()
![]() , (2)
, (2)
where σrm is the current value of the limiting medium stress of
cycle.
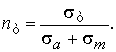
In
computational practice, often use a schematized diagram of the limiting
amplitudes Serensen-Kinasoshvily in which the coefficient ψσ equal
![]() , (3)
, (3)
where σ0 is the
fatigue limit of laboratory samples in a pulsating cycle.
Because
the value of σ0 in the
reference literature is not given, it is recommended to define her by the approximate
formulas [3]. For steels in bending and tension-compression ![]() . Upper limits refer to mild steels. It is easy to
notice that with this choice of σ0, after
substitution in (3) the coefficients ψσ will be constant, independent of the
mechanical characteristics of the material.
. Upper limits refer to mild steels. It is easy to
notice that with this choice of σ0, after
substitution in (3) the coefficients ψσ will be constant, independent of the
mechanical characteristics of the material.
In
[1] for steels calculation ψσ it is
proposed that the formula
![]() , (4)
, (4)
where
σv is the tensile
strength, MPa.
From
(4) it follows that ψσ varies
from 0.1 at σv = 400
MPa, while σv = 1500
MPa to 0.32.
The
value of ψσ can be
determined by constructing the author's proposed new schematized diagram of
limit cycles sra = f(srm). To do
this, use for limit cycles linear dependence Goodman [4]
![]() , (5)
, (5)
and parabolic Gerbera [4]
![]() . (6)
. (6)
|
|
|
Fig. 1. Chart of
the limiting amplitudes for steel 40XH: 1 – direct of Goodman; 2 – Gerber
parabola; 3 – marginal direct Serensen-Kinasoshvily(s0 = 1,6s-1); 4 – proposed direct s0 = 1,8s-1; 3’ – the same when s0 = 1,6s-1 4 – proposed direct schematized diagram |
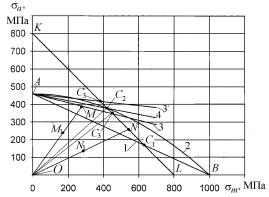
In
Fig.1 for steel 40XH (with the characteristics of mechanical strength in MPa:
tensile strength σv =1000; yield
strength σ0,2=800;
endurance limit of a symmetric cycle σ-1=460) the diagrams of the limiting amplitudes
using the dependences (5) – direct 1 and (6) – curve 2.
For
parts made from plastic materials according to (5) and (6) are valid as the
threat to them is sra = f(srm) only on a portion
of the chart not only fatigue, but also
the transition for the yield strength, which leads to residual deformations
that distort the shape and dimensions of the part.
Therefore, the maximum stress cycles must be less not
only endurance limit, and yield strength smax = sa + sm < s0,2.
In order to exclude from the chart sra = f(srm) the area
where the limiting maximum stress σrmax=sra + srm > s0,2, take the
straight line KL, which cuts off on
the cuts the coordinate OL and OK is equal to the yield strength (steel
40XH s0,2 = 800
MPa, Fig. 1). The equation of a line KL
is:
![]() . (7)
. (7)
Thus, for the parts made of plastic materials chart
limit amplitude in the coordinate axes sm-sa is
limited by the line 1 and the parabola 2 (Fig. 1) until they intersect at the
points C1 and C2 with direct KL, and more – direct C1L or C2L. The coordinates of the points of the
broken lines AC1L or AC2L give limit values and depending on the
selected function sra = f(srm).
Replace plot charts Goodman and Gerber schematized
diagrams. In Fig.1 by equation (2) with (3) built direct limit
Serensen-Kinasoshvily 3, assuming ψσ= 0,11)
and 3’, ψσ= 0.25 to
crossing them with direct KL at the
points and respectively. Note that the direct limit ![]() (if taken
(if taken ![]() ) will be above the Gerber parabola, which contradicts
the results of studies P. Forrest [4].
) will be above the Gerber parabola, which contradicts
the results of studies P. Forrest [4].
For steel 40XH, using (4), find the value of ψσ= 0,22.
Limit direct, built according to (4), in this case almost coincides with the
straight 3’ (Fig. 1).
Build a schematized diagram using three points σ0,2,
σ-1 and the
coordinates of the point of intersection C2
(![]() ) Gerber parabola with a straight KL. Combine in a system of dependency (7) and (8), after the
decision of who will receive the coordinates of the point C2 (
) Gerber parabola with a straight KL. Combine in a system of dependency (7) and (8), after the
decision of who will receive the coordinates of the point C2 (![]() ):
):
 (8)
(8)
 . (9)
. (9)
Connecting points A
and C2(![]() ), get a new schematized diagram OAC2L (Fig. 1)
in which the tangent of the slope of the straight AC2 to x-axis , considering the influence ys is
numerically equal to the coefficient of
medium stress (constant component of the cycle) at the limit of endurance:
), get a new schematized diagram OAC2L (Fig. 1)
in which the tangent of the slope of the straight AC2 to x-axis , considering the influence ys is
numerically equal to the coefficient of
medium stress (constant component of the cycle) at the limit of endurance:
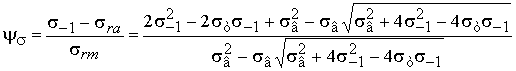 . (10)
When
calculating the value ys according
to the formula (10) are used, only those characteristics of mechanical
strength, which are listed in the reference literature.
Formulas (8) and (9) allow us to determine what type
of destruction is dangerous for a known working medium sm and the
amplitude sa stresses.
If during the calculation details sm/ sa < srm /sra , the duty
cycle of stresses is in the field OAC2
(Fig. 1) and calculate the factor of safety should be based on (1). If sm/ sa > srm /sra, the calculation is based on [1-3]:
 (11)
(11)
The values of the coefficients ψσ and
relations limit srm /sra, can be defined by the formulas (9), (10) and (11) for steels, if known
mechanical characteristics of the materials.
In our proposed schematized diagram direct limit AC2 is located between the
parabola 2 and 1 direct, i.e., it satisfies the experimental data for ductile
metals [4, 5].
LITERATURE
1. Kogaev V. P., Makhutov N. A., Gusenkov A. P.
Calculations of machine parts and structures for strength and durability:
Handbook – M.: Mashinostroenie, 1985. – 224 p.
2. Birger I. A., Shorr B. F., Iosilevich G. B.
Calculation of the strength of machine parts. Handbook. – M.: Mashinostroenie,
1993. – 640 p.
3. Handbook on strength of materials // M. N.
Rudizin, P. Y. Artemov, M. I. Lyuboshitz.; Under the editorship of M. N.
Radizina. – Minsk: Vysheishaya school, 1970. - 630 p.
4. Forrest P. Fatigue of metals. Translation
from English. Under the editorship of S. V. Sorensen. – M.: Mashinostroenie,
1968. – 352 p.
5. Collins J. Damage of materials in
structures. Analysis, prediction, prevention: Trans. from engl. – M.: Mir,
1984.– 624 p.
6. Gots A. N. The calculations of the strength
of engine parts with voltages, variable in time/A. N. Gots – 3-e Izd. – M.:
FORUM; infra-m, 2013 – 208 p.http://www.translate.ru/%28%F2%E0%EChttp://www.translate.ru/%28%F2%E0%EC