Хімія та хімічні технології/ 6. Органічна хімія
O. I. Panasenko, V. P. Buryak, A. S. Gotsulya, A. A.
Safonov, N. A. Postol
Zaporozhye State Medical University
NIPHEDIPINE
AND AMLODIPINE IDENTIFICATION IN ACCORDANCE WITH ITS OPTICAL CHARACTERISTICS OF
THEIR ELECTRONIC BANDS ABSORPTION
Drugs
dandification in accordance with the requirements of modern pharmacopoeia
analysis [1-7] carried out as by a chemical method, as by means of the optical
characteristics of the electronic bands of the maximum UV-spectrum
absorption-position (λmax , nm) of the specific absorption rate (and molar extinction coefficient (![]() ). However, in the case of similar in structure compounds, an applying
of these recommendations is a little tricky.
). However, in the case of similar in structure compounds, an applying
of these recommendations is a little tricky.
On the example of two drugs,
1,4-dihydropyridine derivatives, we proved the possibility of using one of the
methods of mathematical statistics - method of the relative dispersions
comparison for the informational-retrieval system developing for the compounds
identification, using the following absorption spectra parameters as a
half-width absorption band, the ascylyrator strength, integrated intensity and
matrix element of the electrons transition (OOXECB).
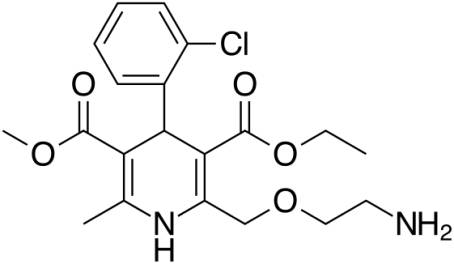
Amlodipine
Niphedipine
Materials and research
methods. For studying of the absorption UV-spectra were used
amodipine and niphedipine standard samples, which we had received from the
State enterprise "Scientific-expert pharmacopoeia centre" Kharkov. As
the solvent was used 95% ethanol, which corresponds to the requirements of the
State Pharmacopoeia of Ukraine.
Amlodipine and niphedipine UV-spectra were measured by means of the
spectrophotometer Shimadzu UV 1800 in quartz cuvettes with a layer thickness 10
mm.
Logical identification. Taking into account the fact that the accuracy of the wavelength
determination is very high (± 0,5 nm) and knowing the number of peaks and also
their corresponding values, it would seem, that by a logical way it is possible
to identify the research drugs that are close to each other in their chemical
structure and therefore have similar absorption spectra. Our researched drugs
amlodipine and nifedipine cannot be recognized by logical way.
Knowing that in the world medical
practice using more than 12,000 individual compounds, undoubtedly, there are
many drugs that have similar UV-spectra, and the difference in their values,
and situated within the spectrophotometer error. We decided to create an
informational-search system for possible automation of the method of drugs
identification based on the use of an additional optical characteristic: the
half-width of the absorption band (∆ν1̸2), ascylyrator strength (f), the integrated intensity (A) and electron
transfer matrix element (MIC).
Statistical method of drugs identification by OOXECB. Assume first that the medicines that we identified relate to a group of
1,4-dihydropyridine derivatives (table 1). The concentration of researched solutions
of drugs in all cases 1 mg % in ethanol.
Table 1
Optical characteristics of electronic absorption spectra of amlodipine
(1) and niphedipine (2)
|
Substance |
λ, nm |
V, cm-1 |
ε· |
lg·ε |
∆ν1̸2 |
A· |
f |
Мік· |
|
1. |
241 |
41500 |
1,56 |
4,19 |
5280 |
0,90 |
0,99 |
3,60 |
|
2. |
243 |
41200 |
1,54 |
4,15 |
4980 |
0,88 |
0,96 |
3,54 |
In our case we have a matrix
consisting of m rows (m - number of drugs, among which cannot be identified the
unknown compound by logical analysis method) and n - column (n - amount taken into account by OOXECB).
And, further, we have the vector-row consists of n OOXECB of the unknown drug.
The problem consists in the identification of a substance, i.e., in its
relation to one of the m unknown substances. Estimated OOXECB are averages from
six parallel measurements.
Successful application of the method
of dispersion's comparison is possible in the case of independent random
quantities that are distributed by normally law. Based on this condition, it is
necessary from the optical characteristics of the electronic absorption spectra
exclude a wave number (νmax)
and![]()
![]() , because they are functionally connected with the values λmax and Emax.
, because they are functionally connected with the values λmax and Emax.
Other characteristics may be taken
into account in the first approximate independent, despite the fact that
between some of them there is a correlation connection.
In order to exclude the influence of
the dimension, it is necessary to consider instead of the optical
characteristics of the electronic spectra their water bearing values:
![]() ;
; ![]() ;
; ![]() ;
; ![]() ;
; ![]() ;
;![]() ; (1),
; (1),
where marked with a star optical
characteristics of electronic spectra of an unknown drug, and at the
denominator's ratio are presented OOXECB of each from the
"theoretically" known drugs. We calculate the squared of deviations
of these indicated relative values from the unity, i.e. (![]() /
/![]() , (
, (![]() /
/![]() ,… (
,… (![]() /
/![]() (2).
(2).
Sum of squared deviations per unit
amounts taken into account optical characteristics (n-1 = 6-1 = 5) will be
present an unbiased assessment of relative values (then used "relative
dispersion")
![]() (
(![]() /
/![]() , (
, (![]() /
/![]() ,… (
,… (![]() /
/![]() (3)
(3)
The minimum sum ![]() amount for any of the same drug
will testify about:
amount for any of the same drug
will testify about: ![]() namely i-th is a drug, is the
fact, that we are looking for:
namely i-th is a drug, is the
fact, that we are looking for:![]()
![]() . If it is necessary to get a statistically significant conclusion is
that the i-th drug is the fact that we are looking for, it is necessary to
compare the relative dispersion
. If it is necessary to get a statistically significant conclusion is
that the i-th drug is the fact that we are looking for, it is necessary to
compare the relative dispersion ![]() with other the nearest
with other the nearest ![]() by its value dispersion for a
drug. Firstly, calculate the dispersion correlation:
by its value dispersion for a
drug. Firstly, calculate the dispersion correlation:
 (4)
(4)
The number of freedom degrees for
this correlation in our case equals to ![]() . If it is
. If it is ![]() , so it is more likely (more than 90%) i-th drug is the drug that we
identify. For a more accurate probability can be used a K. Branuli statistical theory.
, so it is more likely (more than 90%) i-th drug is the drug that we
identify. For a more accurate probability can be used a K. Branuli statistical theory.
For drugs that are the calcium
channel blockers, at first glance it seems that it is not possible to identify
an unknown substance with more than two drugs. However, the identification
practice indicates that for this group of medications cannot be presented more
than two tested compounds which are not amenable to identification.
In our case, a statistical method
that is considering, allows accurately enough to identify an unknown substance.
Identification algorithm
of derivatives of 4,4-dihydro-pyridine by OOHESV. Denote
through ![]() the optical characteristics of
the electronic absorption spectra
the optical characteristics of
the electronic absorption spectra![]()
![]() ; ε;
; ε; ![]() ,
, ![]() . Mik of i-th drug substance (i = 1, 2 ... m; for indicated in table 1
pair of drugs with m = 2).
. Mik of i-th drug substance (i = 1, 2 ... m; for indicated in table 1
pair of drugs with m = 2).
OOHESV
of the unknown medical substance through ![]()
By comparing the optical properties
of an unknown drug with optical characteristics of electronic absorption
spectra of each from i-th drugs, we obtain n values of the relative dispersions
by formula:
 (5).
(5).
Then
we performed a search of the minimal value of the relative dispersions in size
from the smallest to the largest value:
![]()
The second, bigger by its quantity ![]() relative dispersion after mark
relative dispersion after mark ![]() . Calculation of the dispersion correlation performs using the formula 4
(
. Calculation of the dispersion correlation performs using the formula 4
( ). During a comparison of the dispersion correlation
with critical values
). During a comparison of the dispersion correlation
with critical values ![]() , if
, if![]()
![]() , then, i-th drug is our searching compound. If it is necessary, repeat
measurements.
, then, i-th drug is our searching compound. If it is necessary, repeat
measurements.
An example of drug
identification
X1* = 242; x2* = 2,03·104;
x3* = 5,32·103; x4* =
1,10·108; x5* = 1,18; x6* = 4,72·10-18.
It is known that our searching
substance refers to medicines - 1,4-dihydropyridine derivatives.![]()
In table 2 entered indicated values
OOHESV of the unknown drug and theoretical optical characteristics of
electronic spectra of two researched drugs (table 1). Table 2 shows all
calculations of the relative dispersions. As the calculation results show, the
lowest value of relative dispersion Si2 = 18,94·104 is obtained by
comparing an unknown medical substance with niphedipine. The next relative
dispersion equals to 35,98, compared with ![]() amlodipine.
amlodipine.
The dispersion corellation ![]() and is more amount
and is more amount ![]() . Therefore, with more relativity, in accordance with normal
distribution law by K. Browne with a probability more than 90% we could
consider that our unknown substance is amlodipine.
. Therefore, with more relativity, in accordance with normal
distribution law by K. Browne with a probability more than 90% we could
consider that our unknown substance is amlodipine.
For drugs identification by the
basic optical characteristics of electronic absorption bands by means of a
computer, is compiled programs algorithm (table 2).
Table 2
Identification of an unknown compound (1), from the
group of calcium, amlodipine (2) and nifedipine (3) antagonists
|
Substance |
Symbol |
|
|
|
Xi4=A·108 |
|
|
|
|
|
1 |
2 |
3 |
4 |
5 |
6 |
7 |
8 |
9 |
10 |
|
1 |
|
242 |
1,49· |
8660 |
1,30 |
1,42 |
5,08 |
- |
- |
|
2 |
|
241 0,172 |
1,56· 20,13 |
5280 4,098 |
0,90 1,975 |
0,99 1886 |
3,60 1,690 |
- 9669 |
- 1934 |
|
3 |
|
243 0,169 |
1,54· 24,30 |
4,980 24,70 |
0,88 23,41 |
0,96 19,46 |
3,54 24,59 |
- 116,6 |
- 23,32 |
For medicinal substances, a calcium antagonist at first it seems
that it is impossible to identify an unknown substance with more than two
drugs. However, the identification practice shows that for this group of drugs
more than two drugs cannot be among the test compounds which cannot be
identified.
CONCLUSIONS
1. It is established that the values
of half-width ∆ν1̸2 and integral intensity of A
absorption bands, oscillator strength f and the electrons transition matrix Mik
element can be use as important constants of medicines for their
identification.
2. The values A, f and Mik could
serve as characteristic constants for 1,4-dihydropyridine derivative side
identification, because they differ for individual substances on 90%.
3. By the integral intensity
quantities, oscillator strength and the electrons transition matrix element for
test substances, such a row: amlodipinniphedipin.
4. Created the algorithm of a
program for personal computers for drugs identification, summing the optical
properties of their electronic absorption spectra (A, f, Mik), which can be realized by means of computer.
LITERATURE
1. Analytical Chemistry in the
creation, standardization and quality control of drugs. (Public. by cor.-memb.
of NAS of Ukraine of V. P. Georgievskyi). – Kharkov: "NTMT",
2011. – Vol.1. – 464 p., vol. 2. – 474 p., vol. 3. – 520 p.
2. Brawngly K. Statistic Theory and
methodology in science and technology M.: Science 2007. – 408 p.
3. British Pharmacopoeia. – London:
HMSO, 2001. – 1398 p.
4. Buryak V. P. Application of basic
characteristics of UV- spektra in pharmacy / V. P. Buryak // Pharmacy, 1997. –
Vol. 48. – № 4. – P. 46-50.
5. Buryak V. P. Application of
optical characteristics of electronic absorption bands in pharmaceutical
analysis / V. P. Buryak, Z. B. Moryak // Pharmacy, 1998, vol. 49. – № 2. – P.
19-23.
6. Buryak V. P., Tymoshyk J. V.
Spectral characteristic of drugs - calcium blockers / J. V. Tymoshyk, V. P.
Buryak, V. V. Petrenko // Zaporozh. Med. Zh. – 2008. – № 4 (49). – P. 88-93.
7. European Pharmacopoeia. – 5th ed.
– Strasbourg: European Department for the Quality of Medicines. – 2004. – P.
1222-1223.
8. Japan’s Pharmacopoeia. – XIV-d. –
2001. – 1090 p.
9. State Pharmacopoeia of Ukraine /
State enterprise "Scientific - expert center". - 1st public. –
Kharkov: RIREH, 2001. – 520 p.
10. United States Pharmacopoeia. –
24th ed. – 2000. – CD-ROM – version.