Modern
information technologies/3. The software
Candidate of Physical and Mathematical Sciences Prokopenko E.V.,
candidate of technical science Kolokolnikova A.I.
Kuzbass state technical University named after T.F.Gorbachev, Russia
Application
of spline – interpolation methods for
the analysis and processing of statistics in medicine
The development of effective
mathematical techniques for the analysis and processing of medical statistical data is very important.
Let's consider the use of the results of computer simulation [1] for the early
identification of people who consume
psychoactive substances. Drug abuse can
become a cause of misconduct
and antisocial behavior, predisposition to lying, stealing and violence. Identification of people with substance abuse can prevent
allow them to drive vehicles. This will help to reduce the accident rate on the
roads. The above-mentioned problem and the need for its resolving defined the practical significance and relevance of this research.
The
study of data about patients in drug treatment clinics allows to get the anamnesis
of the patient - information about the origin and
course of the disease. In the early stages the periods of drug intoxication are
short-lived and rare, they even may not be seen (figure 1). Drug-related behavior can be
observed during the phases
of preparation P or intaking
the drugs A, but both of these phases are short-lived and usually
take place in secrecy.
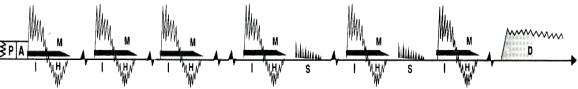
Fig.
1. The stage of the disease
The change of
behavior, reflexes and physiological indicators, for example, the reaction to
the light, pulse frequency can be seen, and sometimes investigated during the phase of intoxication I or the phase after intoxication asthenia H. Drugs or their metabolites (products of
transformations in the body) can be detected in biological fluids in the
long-phase M, within a few days after the end of the intoxication.
A variety of transient disturbances
S, fatigue or memory loss may occur after multiple-dose
introduction of drugs. Their relationship to drug is often overlooked. The later stages of drug addiction may cause
chronic disorders or physical signs D, making the consumer of psychoactive stimulant easily recognizable on abnormality of movements smoothness.
The study of data sets of
addiction clinics patients
allows investigating in
the mathematical model the dependence between the time of
drug use, the
volume of the consumed doses
and "quality of life" of drug-dependent patients. When
considering the graphical representation of this dependence
it turns out that the statistical data for constructing a curve, describing the
treatment history of the patient, contains a lot of points.
Therefore, the technique based on the spline surfaces was proposed to process health statistics. Spline interpolation method allows to conduct the
approximating curve as close as possible to the
experimental points. From a mathematical point of view, the curve for this data set is a compound curve. In
contrast to the
Lagrange interpolation polynomial
and cubic
splines on a equally spaced grid this
study requires the organization of irregular grid modeling, the analysis of planar and spatial properties of
elementary and composite B-spline curves, the use of canonical models of B-spline curves [2].
This study examined arrays of data on the use of "medium" and "strong" by the action of the
drug on two groups of patients with known periods of their use. If
the period of drug
use is displayed on the axis
OX, the amount of
the drug – on the axis OY, duration (hours)
- on the axis OZ,
the array of statistics can be
interpreted as a set of points in three- or two-dimensional
space. On
this array, you can build a spatial B-spline curve, identify and learn its canonical
model. The curve corresponding to canonical model,
can be considered as a curve of normal conditions of life of the patient. In the study of fragments of the integral curve constructed from the
data bank of studied patients, it
turned out that at some points, i.e. in
the periods of life in certain parts of the array, a canonical curve type could
not be defined (figure 2).
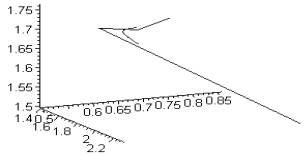
Fig.
2. The curve of critical moment
When considering the data it turned out that each array for which the corresponding curve of canonical type is not defined, matches
to a certain "critical"
period of the disease. In the case of such an indicator of the health of the patient the final analysis and recommendations should
be given by doctors. Statistics were
examined on a group of 250 people, and
in 77% of the «critical» periods coincided 82% [3].
The results provide a basis for predicting and identifying measures for effective monitoring and
control the condition of patients after release from
the medical institution. Such
technique of analysis and visualization of medical statistics based on methods
of spline – interpolation can be
used in a health
survey of the population.
Literature:
1. Kolokolnikova.
A. Computer modeling as an active method of training // the European Science
and Technology: 2nd International scientific conference. Fur krankenschwester
Rodnik e. V. Wiesbaden. 2012. p. 265-273.
2. Prokopenko,
E.V. The canonical model of the cubic parameterized curves [electric]:
Investigated in Russia / E.V. Prokopenko. - Mode of access:
http://zhurnal.ape.relarn.ru/articles/2008/029.pdf. - p. 329-337
3. Prokopenko, E.V. Computer complex of storage and processing of diagnostic information in the narcological dispensary [text]:
abstracts of the thirteenth regional conference on mathematics MAK-2010/ E.V.
Prokopenko. - Barnaul, 2010. - p. 106-107.