Zhitnikov S.A., Yemelina N.K.
Karaganda economic university of Kazpotrebsojuz, Kazakhstan
THE
ANALYSIS AND THE FORECAST OF THE CONSUMER DEMAND OF CENTRAL KAZAKHSTAN MARKETS
Abstract
Studying the consumer demand, factors determing
its volume and structure, forecasting of potential market capacity is the most
important task for the formation of strategy of the commercial activity of
retail commercial enterprises. This task is to determine the optimum food stock and to carry out a price policy
for the most uantity satisfaction of the consumer demand.The research of consumer
demand and motives by which they are guided, purchasing, is carried out with
the aid of uantity these processes.
In connection with the urgency of stated
problem, the research of the foodstuffs and manufactured goods has been done by
us in a number of cities of the Central Kazakhstan such as Karaganda,
Ekibastuz, Stepnogorsk, Temirtau. The
given research has been directed on studying of the dependence of population
demand for foodstuffs (including tobacco products) and manufactured goods, on family
purchasing funds and other factors.
Introduction
Income usually used as an indicator for the consumption
estimating. For example A.Karapetyan used average income of household per
capita as the main indicator determined the population’s consumption. By the
opinion of the other researcher A.Surinov this indicator should be the
aggregate income, that means in the terminology of the system of national
accounting the disposable national income that includes the consumption of free
and benefit services.
In the modern period of development of economy there is a number of the reasons on which the objective income information of housekeeping is inaccessible: Management of statistics has no information on income received as a result of self-employment, from selling or letting the property and so on. In market condition exists the tendency to conceal the income from revenue because people don’t want to pay the tax. Besides, private businessmen use in some cases part income of the other members of their families for the circulating assets replenishment of their own enterprise, in others, on the contrary, they turn a part of their profit to household budget.
We consider that purchasing funds are more adequate
figure, defining the demand of the population, than the figure of the income. Family
purchasing funds include all commodity expenses, i.e. total expenses on foodstuffs
and manufactured goods.
Methods
For the consumer demand modeling we use the population questioning that was developed by us. That was the questioning among the retail network consumers by a method of questioning of a representative sample. The questionnaire developed by us allows to obtain the objective data since we did not ask about household’s income but only about the expenditures for some products and some other goods.
We used correlation-regressive modeling
as a method of the factorial analysis. The multiple correlation-regressive
model has been deduced to study the dependence of the demand of the population for
foodstuffs from several factors, which includes the following factors:
-an average monthly purchasing funds on the basis of one member of the
family (х1);
-an average monthly expenses on manufactured goods on the basis of one
member of the family (х2);
- an expenses on municipal service
(the gas, heating, hot and cool water, electric power, removal of the rubbish, communal
economy) at month for one member of the family (х3);
- an average monthly expenditure for education (х4).
The average monthly expenses
on foodstuffs was taken as dependent
variable on the basis of one member of the family (y).
Substituting value of the exerpts we have got unknown equation of multiple
regression:
![]() (1)
(1)
The coefficient of determination for given model is:
R2=0,9.
This shows that the given model
adequately describes the connection between considered factorial and effective
sign.
Results and Discussion
From equation is seen that value of
average monthly expenses on foodstuffs
was taken on the basis of one member of the family:
·
on average expenses will rise by 341 tenge when the purchasing fund increase
by 1 thousand tenge under other equal.It’s possible to judge about the close
connection with the help of the coefficient of correlation -![]() the connection is close enough.
the connection is close enough.
·
will be cut down on average on 943 tenge
when the expenses
on manufactured
goods increase by 1 thousand tenge under other equal. In other words in
view of the fixed income the spending spree on manufactured goods is the result
of decreasing of foodstuffs consumption. The coefficient of correlation
between the expenses on foodstuffs and manufactured goods is: ![]() .
.
·
will increase on average on 53 tenge when the expenses on municipal service
increase by 1 thousand tenge under other equal. There is no connection between
the expenses on foodstuffs and municipal
service. The expenses increase uantitytion irrespective of each other. It can
be illustrated by the coefficient of correlation:![]()
·
will decrease on 97 tenge when the expenses on education increase by 1thousand tenge under other equal, thereby educational
costs occupy the definite place in family expenses. That’s why the increase in
tuition practically will not influence on the foodstuffs consumption at all.
This fact can be confirmed by the obtained coefficient of correlation between given
data: ![]() .
.
On the ground of analysis of aforecited
results of calculation, we can draw a conclusion that the only one of
considered factor х1 (the average monthly
purchasing funds on the basis of one member of the family) exerts essential
influence upon resulting sign y (the expenses on foodstuffs on the basis of one
member of the family). The rest selected factors can be ignored.
The multiple correlation-regressive
model has been deduced to study the dependence of the expenses on manufactured goods upon demographic factor, which includes
the following factors:
- an average monthly purchasing
funds on the basis of one member of the family (х1);
-a part of working family members in gross amount (х2);
-a number of children under age (х3);
-a number of the adult members of family (senior 16 years) female ((х4).
The resulting sign (у) is the average monthly
expenses on manufactured goods on the basis of one member of the family.
The multiple regression equation
was deduced after uantitytion of the given excerpts
![]() (2)
(2)
The coefficients of the equation
mean that value of the average monthly expenses on manufactured goods on the
basis of one member of the family:
·
will increase on average on 350 tenge if the purchasing funds increase on
1 thousand tenge under other equal;
·
will increase on the average on 390 tenge if the part of working members of the family increases in gross
amount by 1% under other equal;
·
is growing on the average on 68 tenge if the number of the children
under age increases on 1 person under other equal;
·
increases on 109 tenge if the
number of the adult female members of
the family increases on 1 person under other equal.
The coefficient of determination for given model is:
R2=0,58.
According to the following
coefficients of correlation: ![]() we can
consider about the closeness of connection of each factors with resulting sign.
we can
consider about the closeness of connection of each factors with resulting sign.
Either as in previous model the close
connection exists only between resulting sign.It means that connection exists
between the expenses on manufactured goods and purchasing funds of the family. The connection with the rest considered factors is too loose so it
can’t be taken into account.
It is seen from equations that if
purchasing funds of the family increase on1 thousand tenge, the expenses on foodstuffs
will increase on 341 tenge, but the expenses on manufactured goods rise on 350 tenge
on the basis of one member of the family
at month. Thereby, with growing of the means, population of Central Kazakhstan
buys more expensive foodstuffs such as
meat, sausages, fish product; the range of food increases. At the same time,
growing of the purchasing fund of the family leads to increasing of average monthly expenses on manufactured
goods. It is quite possible that population buys more expensive household chemical goods (powder,
shampoo, etc.), or there is an increase in the number of clothes, which they
buy.
F – statistics of the coefficient of determination in equation (1) is F=1336 in equation (2) is F=205,7.
As the obtained values are higher
than Fisher’s critical points of distribution when the significance level is 1%.
All this confirms statistical value of coefficient.
Some types of nonlinear correlation
have been considered to study the dependence between average monthly expenses
on foodstuffs and manufactured goods and purchasing funds of the family (Table
1):
Table 1.
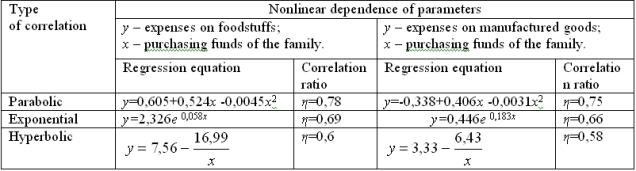 Judging from correlation
ratio, the parabola describes the connection between factorial and resulting
sign in the best way.
Judging from correlation
ratio, the parabola describes the connection between factorial and resulting
sign in the best way.
Elasticity coefficients have
different data.They show how y changes if the factor increases by 1%. It depends on the type of correlation between the demand for foodstuffs and manufactured goods and purchasing
funds of family (Table 2).
Table 2.
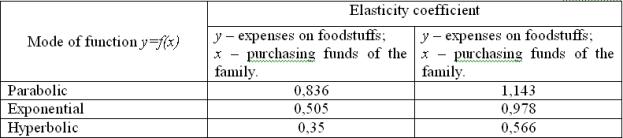
On the ground of the fact that
parabolic correlation is more acceptable
for forecasting the demand for foodstuffs and manufactured goods, elasticity
coefficients show that if the purchasing funds increase by 1% demand for foodstuffs
increases in average by 0,84%, but expenses on manufactured goods will grow on
1,2% at the average.
The demand for goods depends not
only on purchasing power of the consumers, but also on the price of the
product. If the prices are high, the demand for goods is low and vice versa. So
it is important to define, how the change in price can influence on demand. We
use index of demand price flexibility to forecast the purchaser demand of the
consumers. Price elasticity of demand shows how the uantity demanded for goods
will change in percentage if its price changes on 1%.
Having calculated the elasticity
coefficients (table 3) , we have got the numerical attributes of price elasticity
demand of the separate food.
Table 3.
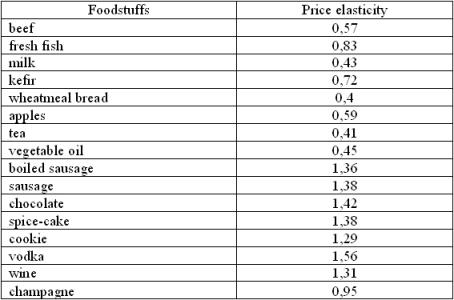
Given in table 3 data demonstrate
that demand for daily food (milk, bread, tea, vegetable oil) is inelastic. The
percentage change of volume demand for these goods is less, than percentage
change in price. At present bread and milk are main food and increase in price
will not reflect on volume demand for given foodstuffs.
The demand for products,
which are more expensive such as sausage, chocolate, alcohol drinks is more flexible.
In other words, change in price will lead to the greater quantitative change in demand.
The reaction of the consumers on
the price- level change on goods interests the producer from the point of view
of the receipts, which provides the rise in efficiency of production and receipt receiving.
The notion of cross elasticity demand is used to determine severity
of exposure to quantity demanded for these goods if there’s the change in price
of other goods. The coefficient value of cross elasticity depends on the
concerned goods if it’s interchangeable or complementary. For instance, if meat
goes up in price on 10% the demand on fish will increase by 1,4% or, for
example, rise in price on tea on 20%
brings to demand reduction for lemons on 0,8%.
Results of the analysis of price elasticity of some manufactured
goods are presented in table 4.
Table 4.
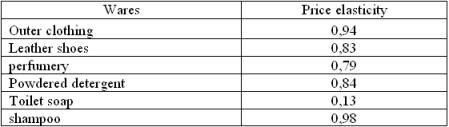
From the table 4 we see that demand
for outer clothing, shampoo possesses average sensitivity to change in the
prices. If the price on shampoo increases by 10% demand for it will decrease in
9,8%.
There is a little change in demand for
the toilet soap. It denotes a high consumer usefulness of this goods. It’s
interesting that demand for perfumery comparatively is inelastic. If there is increase
in the prices on perfume or eau-de-colognes population of Central Kazakhstan
will not shorten buying of this type of goods.
Conclusion
In the terms of market economy
producer constantly keeps up with the level of borrowing power of his production.
Making one time capital inputs and using the theory of price elasticity demand he
can determine both the bottom price selling product and its volume with raised
level of borrowing power. All these actions help producer to obtain the proper
efficiency level. Studying the elasticity of demand for separate goods and market
demand on the whole allows us to forecast market change as a result of carrying
out one or another price policy.
References:
1. Karapetyan A.H. (1980). Incomes
and the Consumption of the USSR Population. Moscow, Russia.
2. Surinov A.E.
(2000). The Experience of the Quantitative Measurement of the Personal Incomes.
The Finances and Statistics, Moscow, Russia.