Технические науки
К.т.н. Коровиков А.Г.
Институт атомной энергии РГП НЯЦ РК, Республика Казахстан
DATA MANAGEMENT SYSTEM FOR KTM TOKAMAK PHYSICAL DIAGNOSTICS
Prototype for KTM Tokamak software for experimental
data of physical diagnostics data handing and presentation is described.
Software is developed on the basis of Java and Web technologies and intended
for data management and analysis after experiments.
1. INTRODUCTION
The construction of Kazakhstan Material Testing Tokamak
KTM is nearing completion. Installation of facility and manufacturing system as
well as calibration of physical diagnostics are under way. Facility is being
created to study material behavior of first wall and diverter in the flow of
heat and plasma particles.
Amount of received data will achieve up to 8 GB per
shot. Information will include recorded signals of diagnostic systems, plasma-physical
parameters calculated on its basis and video files and images. One of the most called
data will be measuring results of physical diagnostics system.
Experimental data of diagnostic systems handling for
research facilities operating in pulsed mode - including Tokamaks – mostly
consists of two phases. The first phase refers to time of experimental
campaigns and aims to get progress for series of physical parameters and rapid
analysis of information for making decisions on further experiments. The second
one relates to in-depth analysis of experimental data, their documentation and
management. Current activities are carried out in the period between the
experimental campaigns.
As for first phase, tasks are mostly solved by means
of information and measuring system. The second phase activities are had to do
by Researcher himself in most cases.
The purpose of the work was to develop data management
system prototype which would include tools for in-depth data analysis, data documenting
automation and sharing.
2. FUNCTIONALITY OF SOFTWARE FOR KTM TOKAMAK DATA
CONVERSATION AND REPRESENTATION
Available tools can be used in order to automate tasks
related to the data analysis phase between campaigns. However, each of Tokamaks
is being created for a definite purpose, has a unique set of diagnostics and operated
under peculiar conditions. Thus, other standards cannot be always used to access
experimental data. Information systems, of course, should support most common
formats of data storage, but it is desirable to avoid possible restrictions on
the ideological and technological frameworks which are caused by these standards.
In addition, the information system affects the fact that they are created for
experimental facilities and requirements for data processing and representation
are steadily increasing. Such a system is needed before entering the facility into
operation, because a large number of tasks associated with the analysis of experimental
data obtained diagnostic-profit systems have to be solved at the stage of setup
and calibration of diagnostics.
Basic requirements for software of physical
diagnostics data management are as follows:
- Storage and visualization of experimental data
recorded signals of diagnostic systems and the processing results in the form
of tables, graphs, video and images, possible expanding forms of visualization;
- Comparison of data from different experiments
- Search for data on the parameters of experiments and
their descriptions
- Mathematical data processing (smoothing, filtering,
subtraction constant interferences, etc.) and expanding ways of processing
- Automatic generation of reports on experimental
data, export them to the desktop apps
- Opportunity to interact with information systems of
existing Tokamaks and with the data in most common formats of storage;
As the requirements for the system conversion and data
reporting are determined by researches carried out on the experimental facility
and programs and directions are often been significantly modified, the system's
architecture must be flexible, expandable and accessible for further development.
One of solutions can be offered by the modern information
technologies is the software in the form of so-called three-tier with
JAVA-based server side. Such an approach would create easy-to-extensible and
portable system provides various operations with data and access to them. JAVA
also has integrated with mathematical packages (MATLAB, SCILAB), and has the
means to communicate with other cross-platform software development.
3. Architecture of data conversation and
representation system in material testing researches at ktm tokamak
Figure
1 shows version of system architecture designed on the basis of requirements mentioned
above.
Figure 1. Architecture
of data conversation and representation system
The system consists of server and client part. Server
part, responsible for storing of information and access to it, is a database
(DB) and server application opinions. Server contains results of data emerged
from the experimentation documents, it interacts with the database, which
stores the original array of information received during the discharge, as well
as with existing Tokamak database, and performs in the action and data
processing. Access to data is performed by the client applications that copy
the necessary data to your computer, contain function of mathematical processing
and export information in the office applications.
Database contains processed information. Signals
are stored as binary objects, indicating the configuration parameters of data
collection (sampling frequency, number of samples, etc.). This database
structure allows you to store both registered and processed signals, events
occurred during discharge, and description of hardware and signal properties. Specialized
table is provided to store complex data (images, video). There are also tables,
designed for storage of user diagrams, descriptions of experiments, comments. Database
contains also diagram of material information, comments, and various kinds of
documentation designed by Researchers. Databases reduced to third normal form.
The database structure is shown in Figure 2.
![]()
Figure 2. Structure of server data base
Application server (AS) integrated in system is
provided to control connections, centralization and optimization of interaction
with data, integration with existing Tokamak information systems. AS accepts requests to receive and process
data. It also retrieves information from database of processed data, produces,
when necessary, additional mathematical processing, generates reporting
documents. AS also includes components to operate with mathematical packages, office
applications and data exchange systems.
Access to data is performed using the client
application, presenting the interface to all the functionality of the system. Having
rights user is able to work with all available data both in general database
and in systems connected to AS. Buffering functions of data requested are
incorporated to client application to reduce network traffic.
Thus, data handing and presentation system
performed on the model basis is functionally completed KTM Tokamak control and
data acquisition system (CODAS). To visualize physical processes Researcher is
able to take advantage of all available information whether there are registered
signals or results of data processing. Each of system components if required can
be extended and system functionality can be increased.
4. prototype of Data Management System for KTM Tokamak
Physical Diagnostics
Prototype of data management
system was designed on the basis previously described. Software package in form
of WEB-services based on JAVA-servlet and a client desktop application was decided
to perform.
The following tools and technologies were used while
designing:
·
DBMS PostgreSQL - available
for free use of database management systems (DBMS). PostgreSQL is one of the
most functionally advanced and reliable, PostgreSQL has been used as a server
database
·
JAVA - currently this product
is no longer just the language of the programming, but also a set of
technologies that allow decompressing efficient server applications operated in
WEB; JAVA was used to develop a server application connecting databases and client
applications
·
APACHE TOMCAT - open container
JAVA-Servlets, designed at JAVA language providing core functionality for the management of connections on server; different
reliability and efficiency, is available for free use; TOMCAT has been
installed on the server as a container for a server application
·
SOAP - communication client-server
protocol based on XML is used in WEB-services, protocol can establish a safe,
open, cross-platform, easily extensible functional data exchange. It was used
for exchange of messages between server and client parts of the system; FTP protocol
was used for experimental data exchange: client sent request to application
server using SOAP, server application prepared necessary data and put it on ftp
server, wherefrom they were took with client application. Such an approach, on
the one hand, complicates transaction management, but on the other one allows
you to use the strengths of a party the two protocols - SOAP flexibility and
speed of FTP, which, in the opinion of the authors, compensates for the first
shortcoming
·
APACHE AXIS - a library that
implements the SOAP protocol in the server side
·
DELPHI - a means of rapid
software development, effective in creating complex multi-functional graphical
interfaces; version of the package BORLAND DEVELOPER STUDIO 2006 was used to
develop a client application
·
OPENOFFICE - an open set of
software for automating office work. Available for free use. Used in the server
part of the system to automate the creation of reporting
·
SCILAB - open mathematical
package was used on the server side for processing.
Figure 3 presents Structure of data
conversation and representation system.
Figure 3. Structure
of data conversation and representation system
The system operates as follows: After the
discharge in KTM facility physical diagnostics data from general KTM database are
copied into the database of processing and representation system, where they
are structured in the context of physical processes in Tokamak, and if necessary,
carried out additional processing. Then data sets for displaying are created in
automatic mode, data screens are made, report documentation is generated, which
also added to the database system of processing and representation system. Users
of client applications can see both data of current discharge, and information
on the results of far companies took from database of processing and reporting
system. Also, if necessary, user can access data external information systems
of Tokamaks. This load of tips and information processing is distributed
between the two systems - KTM CODAS and data management system, so that
resource-intensive operations to find necessary information in internal and
external database does not affect the possibility of further time-series of experiments.
In addition, experimental processing can be started on the server of data
management system, which also does not affect the performance of КТМ CODAS and time of discharge. There are two levels in
dealing with information - data level of current discharge and after-startup
processing level.
Additionally, specialists can receive reporting
documents generated by server on the basis of experimental data.
Herewith interface to system is presented in
the form of a single client application which screen image is shown in Figure
4.
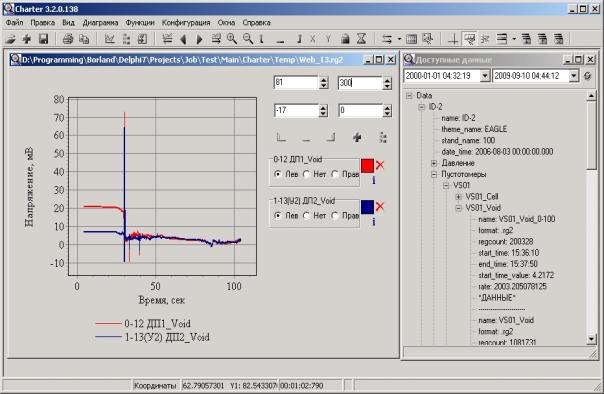
Figure 4.
Screenshot of client application
Application interface is a multiple-window.
Thus, it is expected to enlarge the possibility of data analysis and manipulation,
thus saving the space onscreen. User can form diagrams to view: one chart is in
one window, chart can contain from one to thirty-two curves.
Information on currently available data is shown
as tree that make possible to structure information and to save screen space. Filling
nodes with data is occurred at the time of expansion, thus shortening the time required
to form a data tree. Nodes can be either open or close on default.
While working it is often needed referring to
certain parts of the diagram with set-up a certain way curves. This feature is
implemented using tabs (Fig. 4, located to the right of the list of curves).
Pressing the left mouse button results in "remembering"
fragment, and clicking on the right - the transition to it. Information on the
settings tab is given in the form of a tooltip; you can change options by
selecting item from popup menu. The diagram may contain an indeterminate number
of bookmarks.
Since the unused controls are actually
"visual noise" for user, bookmarks bar and bar chart settings can be
optionally hidden either by pressing buttons on the toolbar or double-clicking
on the diagram.
There are also a synchronizing cursor which is
shown in all windows simultaneously, tooltips of precise values of signals and
mode of visualization signal as a table.
Often while working with data it is necessary
to re-use diagrams received before. For this purpose, it is possible to
maintain the schedule in small text file. File does not contain direct data,
but it has information about what data was discovered, from what sources they
were obtained, and how the diagram looked. All the settings are being saved including
above tabs. "Shape" of the diagram obtained in this way can be
e-mailed to colleague or stored in database for further use.
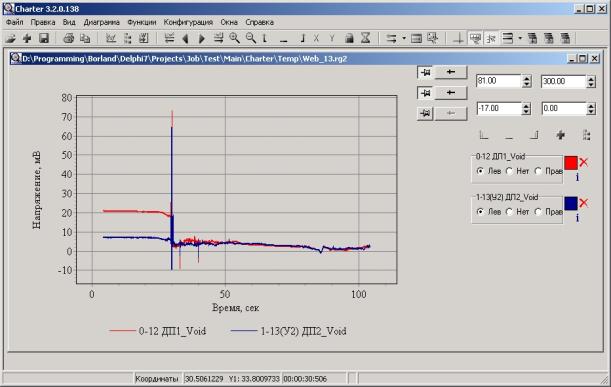
Figure 5.
Screenshot of client application - 2
Data can be transferred to MS Word and MS Excel
applications, saved as a tables and bitmap images.
There is also tools for automatic generation of
reports in client applications. User can “ask” a system to create a document
which would contain some charts based on shapes constructed earlier just by
picking shapes. Then server will generate MS Word document with images inside.
After that user can add necessary text to this document. Or user can write text
first and add into it special markers with names of shape and then send this
template into the system which will
replace text markers with graphical images.
Thus, Researcher gets an opportunity to work
with all the data available in one environment.
Following are the main features of the designed
system:
- Storage and visualization of experimental
data recorded signals and processing results in form of tables and graphs,
multimedia information;
- Ability to compare data from different
experiments;
- Search for data on the parameters of
experiments and their descriptions;
- Mathematical data processing (smoothing,
filtering, subtraction, pickup, etc.)
- Sampling time windows from recorded signals,
change of sampling frequency;
- Automatic generation of reports on
experimental data, export to office applications;
Functionality of system components is
distributed as follows: AS is interacted with server database, contains
features sample time windows of signal and change the sampling frequency, components
of mathematical processing. Client application allows visualizing data,
performing simple mathematical processing, and exporting data to MS EXCEL, MS
WORD, as well as text and binary files.
All these features allow performing set of
basic functions required to work with the experimental data of physical
diagnostics. System architecture allows expanding ways of data visualization
and methods of their processing.
5. Conclusion
Thus, experience with KTM Tokamak experimental
data was accumulated including creation of WEB-service intended to meet the
challenges associated with the secondary data processing, storing and
supporting documentation, information retrieval, organization of data exchange
and automatic generation of reports. Information from experimental results’ database
as a part of KTM automation system is appears as raw data for service herewith.
The following was concluded:
- designed data conversion and representation
system implements functionality basic set required to manage KTM Tokamak experimental
data of physical diagnostics. The system can be a kind of skeleton around which
could be built additional functionality (including components for so-called
"data mining") increasing the capacity of the system and effectiveness
of research
- cross-platform software available for free
application was used in development that on the one hand reduces system cost,
and on the other one gets opportunities for migration with WINDOWS to LINUX for
and v.v. therefore data management system resistance to possible changes in the
software market is being increased
- designed software was successfully used in
verification and calibration of KTM Tokamak physical diagnostics and
demonstrated sufficient efficacy in dealing with this kind of data.
System integration into KTM CODAS is expected
to be as a next stage of Project realization. Data processing and
representation system will significantly expand the functionality of KTM CODAS
and provides normalized access to experimental data to both KTM and other existing
Tokamaks. It is encourages to optimize activity of specialists involved, improve
quality and reduce cost.
REFERENCES
1. Гарсиа-Молина,
Г. Системы баз данных. полный курс / Г. Гарсиа-Молина, Д. Ульман, Д. Уидом. –М.
: Издательский дом «Вильямс», 2004. –1088 с.
2. Ларман, К. Применение UML и шаблонов
проектирования / К. Ларман. –М. : Издательский дом «Вильямс», 2004. – 736 с