Study of the gas migration in
Paris basin
Aidana MURATBEKOVA[1], Raymond
MICHELS[2],
Irina PANFILOVA[3],
Talgat Ensepbayev[4]
[1] Kazakh National
Technical University named K.I.Satpaev, Almaty, KAZAKHSTAN aidanochka@mail.ru
[1] Laboratory
“GeoRessoureces”, Nancy, FRANCE
[1] Laboratory “LEMTA”,
Nancy, FRANCE
[1] Kazakh National
Technical University named K.I.Satpaev, Almaty, KAZAKHSTAN
Abstract
The
main objective of this study was to understand the gases migration in the Paris
basin. The analysis of different hypothesis was made on the data from ANDRA’s
drillings EST433 in the Meuse – Haute Marne area. These data are sedimentary
logs, gases concentration profiles and petrophysical data. Thanks to a
geological study of the sector, it was expected to explain the origin and the
migration of the gases. As it was studied before by Prinzhofer et al.
(2009), the migration of gases,
dissolved in porewater can be explained
by processes, as diffusion, adsorption, and by flux of aquifer in some of
layers. So to verify the consistency of the hypothesis and to better understand
the gas migration in this region, there was made the simulation with Comsol
software.
Methane
concentration measurements made at various depths along a 2000 m depth borehole
drilled in the eastern part of the Paris basin and reaching the Triassic
conglomerates were used to establish a vertical profile of dissolved methane
concentration and hydrocarbon gases molar composition. Wireline logging tools
were used to measure porosity in the various formations. Shallower levels show
the highest methane concentration, and going upwards, values are getting lower,
yet molar compositions show a complex pattern. The data set obtained by
wireline logging measurements was used as inputs for numerical simulations of
1D methane diffusion throughout the 2000 m profile. Several assumptions
regarding the transport properties in the various sedimentary layers were
tested and all were found to yield fairly good agreement between modeled and
measured methane relative molar concentrations in the dissolved hydrocarbon
gases. Moreover, the modeling results suggest that the Keuper massive halite
level associated with the upper Muschelkalk pre-evaporitic series efficiently
isolates the overlying layers from any input from deeper formations in the
Meuse/Haute Marne area. Last, diffusive parameters were plotted according to
Archie’s law, which therefore allows an estimation of ![]() (non-reactive
species) from the knowledge of both the sample total porosity and the
corresponding exponent m = 2. Rock hydrocarbon source potential, clay
lithologies and relationships to aquifers are major parameters which govern gas
diffusion. The overall complex pattern can however be reproduced by the model
and set a physical framework to future combined geological and geochemical
interpretation.
(non-reactive
species) from the knowledge of both the sample total porosity and the
corresponding exponent m = 2. Rock hydrocarbon source potential, clay
lithologies and relationships to aquifers are major parameters which govern gas
diffusion. The overall complex pattern can however be reproduced by the model
and set a physical framework to future combined geological and geochemical
interpretation.
Keywords:
methane, diffusion, convection, aquifers, Paris basin, Comsol, modelling
Introduction
Introduction to the study area
Location of the well EST433 and stratigraphy
The Paris Basin is located in
the northern part of France (Figure 1) and contains sedimentary formations aged from
Triassic to Tertiary (Guillocheau et al., 2000). The study area is in the
eastern part of the Paris basin Ошибка! Источник ссылки не найден.which
is characterized by a basement made of the Carboniferous coal basin. A well was
bored near the URL (EST433 well) to reach the base of the Triassic in order to
estimate the geothermal potential (Landrein et al., 2013). The sedimentary
layer is consisted of sandstone, limestone, marl and clay layers with one main
salt-rich level in the Keuper formation, from 1616 to 1416 m in depth.
Paleo-temperature reconstructions indicate that temperature is between 10-70°C
in basin (Blaise et al., 2014). The main mass transfer process is reported as diffusion (Rebeix et al., 2014). Also from the studies of Landrein et al.(2013) the Paris basin has a geothermal potential.
251658240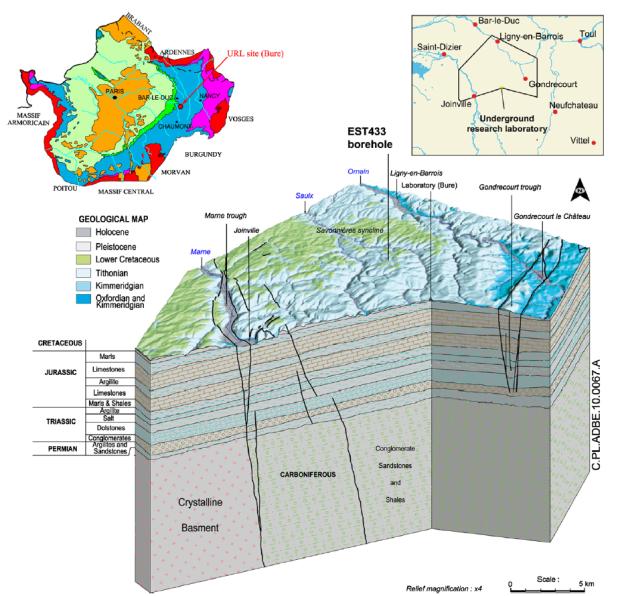
Figure 1 – Geological context of the studied area – Left: the Paris basin (Linard
et al., 2011); Right: the Meuse/Haute-Marne Site. (Battani et al., 2011).
Hydrogeological
background of the aquifers in basin
The sedimentary cover also
includes formations which are known to be aquifers: Tithonian limestones,
Oxfordian limestones, Dogger oolitic limestones, Rhetian bioclastic limestone,
and Buntsandstein sandstones.
The Tithonian aquifer,
situated between ![]() m and the
surface. The second aquifer formation, the Oxfordian limestones, lies between
m and the
surface. The second aquifer formation, the Oxfordian limestones, lies between ![]() m and
m and ![]() m. Average
water content of the Oxfordian layer ranges between 2 and 3%. Seven main levels
of relatively high porosity were identified and were assumed to indicate zones
of relatively high water productivity. Below the COx formation, the Dogger
oolitic limestone aquifer is located between depths of
m. Average
water content of the Oxfordian layer ranges between 2 and 3%. Seven main levels
of relatively high porosity were identified and were assumed to indicate zones
of relatively high water productivity. Below the COx formation, the Dogger
oolitic limestone aquifer is located between depths of ![]() m to
m to ![]() m. The top
10 m of this formation, named the “dalle nacrée” level, correspond to
highly recrystallized carbonates with very limited porosity and permeability.
Over the study area, two water production levels are evidenced (at -710m and
-766m, with a contribution 60 times lower in term of flux for the second one).
The Rhetian bioclastic limestone layer, between
m. The top
10 m of this formation, named the “dalle nacrée” level, correspond to
highly recrystallized carbonates with very limited porosity and permeability.
Over the study area, two water production levels are evidenced (at -710m and
-766m, with a contribution 60 times lower in term of flux for the second one).
The Rhetian bioclastic limestone layer, between ![]() m and
m and ![]() m, is known
to have only limited aquifer characteristics at a regional scale, mainly to the
east of the study area. There, no water circulation has been detected during
drilling of the EST433 borehole. The Buntsandstein sandstones constitute the
deepest aquifer lying between
m, is known
to have only limited aquifer characteristics at a regional scale, mainly to the
east of the study area. There, no water circulation has been detected during
drilling of the EST433 borehole. The Buntsandstein sandstones constitute the
deepest aquifer lying between ![]() and
and ![]() m. Although,
one water production level was encountered in Buntsandstein at
m. Although,
one water production level was encountered in Buntsandstein at ![]() m on the EST433 borehole (Rebeix et al., 2014).
m on the EST433 borehole (Rebeix et al., 2014).
The Dogger aquifer consists of oolithic and reef
limestone (Ошибка! Источник ссылки не найден.)
of low porosity (6–9% average) and low permeability (from ![]() to
to ![]() m/s) (Buschaert et al., 2006). The Oxfordian limestone
aquifer exhibits variable porosity (3 to 25%) and permeability similar to the
Dogger aquifer (from
m/s) (Buschaert et al., 2006). The Oxfordian limestone
aquifer exhibits variable porosity (3 to 25%) and permeability similar to the
Dogger aquifer (from ![]() to
to ![]() m/s) (Delay et al., 2006). Hydrogeological models for the two
aquifers indicate westward flow.
m/s) (Delay et al., 2006). Hydrogeological models for the two
aquifers indicate westward flow.
Stratigraphy of the studied
area with depth indications for platform C can be observed from the article by
Linard et al., 2011.
There are compounds of
hydrocarbon gas (methane, ethane, propane, iso- and normal-butane) presented as
dissolved compounds in the porewater in eastern Paris Basin, France. Results
indicate that the studied hydrocarbons contain significant amounts of ethane,
butane and propane, in addition to methane. Methane concentration in the pore
water profile displays not linear increase in methane concentrations in log
scale with depth. The maximum concentration is in the lower Triassic, the lower
part of the well E433 and further to upper layers, lower becomes methane
concentration values.
In regards to organic geochemistry data (Fleck et al.,
2001; Blaise et al., 2014) two major sources of hydrocarbon gases can be
considered: the carboniferous basement (higher plants coal layers) and the
Liassic marine source rocks. By considering the physical parameters of the rock
layers (lithology, porosity, thickness) contrasted properties were identified
(very low porosity of evaporate layers, low porosity of clay layers, higer permeability
of sandstones or carbonates layers acting as aquifers).
The
groundwater flow is mostly occurs through fractures or connected pores. That is
why the gas migration in liquid-saturated porous medium, as in Paris basin, can
be explained by advective flow combined with diffusion (Rebeix et al., 2014;
Battani et al., 2011). Convection–diffusion equation was used to determine the
mass transport in this medium. As diffusional flow in pores may be described by
an effective diffusion coefficient, the differential equation for mass
transport in a porous material in this numerical simulation can be written as:
|
|
Where,
![]() is a characteristic
concentration of methane in gas mixture, [dimensionless] ;
is a characteristic
concentration of methane in gas mixture, [dimensionless] ;
![]() is the effective
diffusion coefficient in porous medium,
is the effective
diffusion coefficient in porous medium, ![]() ;
; ![]() is Darcy velocity,
is Darcy velocity, ![]() .
.
In
Ошибка! Источник ссылки не найден.
the concentration is shown in percentage of mole fraction. In the numerical
model we use the specific concentration ![]() , which is equal to the ratio between the masse fraction and
its maximum value.
, which is equal to the ratio between the masse fraction and
its maximum value.
The
effective diffusion coefficient for transport through the pores is estimated as
follows:
|
|
2 |
![]() is the diffusion
coefficient of the species in the fluid (e.g., water) without the presence of
the sediment matrix.
is the diffusion
coefficient of the species in the fluid (e.g., water) without the presence of
the sediment matrix.
The
porosity (![]() ) of porous media can be determined (pore size distribution
and tortuosity are unknown). Therefore the effective diffusivity is often
defined as a function of
) of porous media can be determined (pore size distribution
and tortuosity are unknown). Therefore the effective diffusivity is often
defined as a function of ![]() alone (
alone (![]() ). So the effective diffusion can be introduced by following equation:
). So the effective diffusion can be introduced by following equation:
|
|
3 |
Where,
|
|
4 |
This
is called formation factor. Here, ![]() is a fitting
parameter and
is a fitting
parameter and ![]() is a cementation factor.
is a cementation factor.
In
numerical modelling it was taken as ![]() , because in studying this area before by Descostes et al. in
2008 it was mentioned that
, because in studying this area before by Descostes et al. in
2008 it was mentioned that ![]() . This value was discussed before in work of Battani et al.
(2011).
. This value was discussed before in work of Battani et al.
(2011).
In
materials of low porosities as in this study, ![]() , the cementation factor can be more than 2,
, the cementation factor can be more than 2, ![]() (Grathwohl P., 1998).
(Grathwohl P., 1998).
It
was assumed that the molecules of the solute (in our case methane) are
spherical, so the diffusion coefficient of the species in the fluid (e.g.,
water with dissolved gas mixture) without the presence of the sediment matrix
is calculated by Stokes-Einstein eq.:
|
|
5 |
Where,
![]() is a dynamic
viscosity of liquid,
is a dynamic
viscosity of liquid, ![]() or
or ![]() ;
; ![]() is Boltzman constant,
which is equal to:
is Boltzman constant,
which is equal to:
![]()

![]() is a temperature of the medium,
is a temperature of the medium, ![]() ; π is an Euler constant, which is equal to 3.14;
; π is an Euler constant, which is equal to 3.14; ![]() is a molecular radius
of solute,
is a molecular radius
of solute, ![]() ; in our case
; in our case ![]() was taken as a diffusing solute.
was taken as a diffusing solute.
The
dynamic viscosity is an important fluid property when analyzing liquid behavior
and fluid motion near solid boundaries or even diffusion process. So, to be
more precise, viscosity was calculated as a function of temperature in the
equation, which is presented below (Viswanath, 2007).
|
|
Where
![]() ,
, ![]() ,
, ![]() are the empirical
constants, and the values depend on type of fluid. As in our case the medium is
saturated by water, they are in following values:
are the empirical
constants, and the values depend on type of fluid. As in our case the medium is
saturated by water, they are in following values:
![]()
![]()
![]()
From
petrophysical data the cross section was divided into 44 domains, in
relationship to their fluid transport properties (merely permeable vs
impermeable). Indeed, the stratigraphy is dominated by three major types of
lithology deposited during well-defined stratigraphic periods: sandstone in the
lower Triassic, claystone and evaporates during upper Triassic, mainly
claystone during lower Jurassic, carbonates during middle Jurassic, claystone
during upper Jurassic followed by carbonates. (Landrein et al., 2013 for details).
Porosity
Porosity
(![]() ) is a key factor for solute transport process in porewaters.
Wireline logging results indicate that most porosity values range between 0 and
0.25, with some meter-scale highly porous levels (
) is a key factor for solute transport process in porewaters.
Wireline logging results indicate that most porosity values range between 0 and
0.25, with some meter-scale highly porous levels (![]() ).
).
The
temperature influences to the plenty amount of parameters of the fluid
properties, such as in our case, dynamic viscosity. That is why it is important
to identify the temperature gradient values for each domain. It is introduced
in Table 1 The data of hydrological and thermometric measurements
are from article by Landrein P. et al., 2013.
Table 1 – Temperature gradient parameters observed from article by Landrein P. et
al., 2013
|
|
|
|
|
|
|
|
|
|
|
|
|
|
|
|
|
258 |
581 |
323 |
288,06 |
296,08 |
8,02 |
0,0248 |
|
581 |
691 |
110 |
296,08 |
300,1 |
4,02 |
0,0365 |
|
691 |
937 |
246 |
300,1 |
306,26 |
6,16 |
0,0250 |
|
937 |
1135 |
198 |
306,26 |
314,16 |
7,9 |
0,0399 |
|
1135 |
1415 |
280 |
314,16 |
326,54 |
12,38 |
0,0442 |
|
1415 |
1611 |
196 |
326,54 |
330,76 |
4,22 |
0,0215 |
|
1611 |
1862 |
251 |
330,76 |
339,15 |
8,39 |
0,0334 |
![]() is the thickness of
the domain between
is the thickness of
the domain between ![]() and
and ![]() ,
, ![]()
![]() is the difference
between
is the difference
between ![]() and
and![]() ,
, ![]()
![]() is the temperature
gradient in domain with thickness
is the temperature
gradient in domain with thickness ![]() ,
, ![]()
In Comsol temperature is given by
following equation:
|
|
7 |
Where, ![]() is the lowest
temperature for each domain,
is the lowest
temperature for each domain, ![]() ;
; ![]() is the depth at the
lowest temperature,
is the depth at the
lowest temperature, ![]() ;
; ![]() is the temperature
gradient for each domain,
is the temperature
gradient for each domain, ![]() . After entering, it was observed the dependence of depth and
temperature, figured in Ошибка! Источник ссылки не найден..
. After entering, it was observed the dependence of depth and
temperature, figured in Ошибка! Источник ссылки не найден..
251658240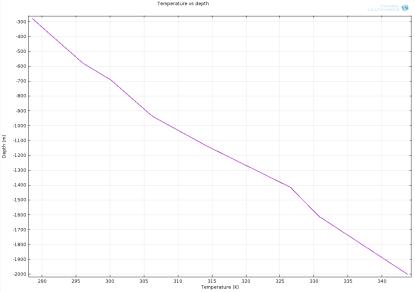
Figure 2 – Thermal profile of EST433 as generated by
Comsol using the parameters selected from tables 3
The
value of dynamic viscosity was inserted for all domains by the equation 1 The result of entering equation for viscosity is
shown in Figure 3.
251658240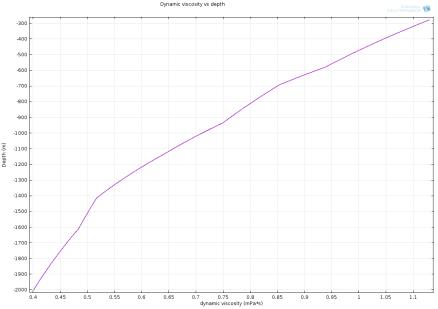
Figure 3 – Water
dynamic viscosity profile as a function of depth in the EST433 well in calculation using Comsol, the equation 1 and
parameters defined in tables 3
From this graphic, it is easy to determine that upper
we are, water becomes more viscous. And it causes to decreasing of the
diffusion coefficient ![]()
It
is necessary to introduce time limit for the equation. For the simulation 200
million years was chosen. Because the age of the first significant cap-rock
deposit: the upper Triassic is 200 million years, even 270 million years is the
oldest age of gas formation from the Carboniferous source-rocks. So as a time
limit, it was taken as 200 million years for diffusion process.
Conclusion
The
objective of this study was to understand the gases migration in the Paris
basin. In this article I tried to make some investigation af articles and data
from ANDRA’s EST433 drilling in the Meuse – Haute Marne area. It was clear that
the migration of gas is caused by additional sources, not only by diffusion of
hydrocarbon from the carboniferous basement So, to verify the
consistency of the hypothesis and to better understand the gas migration in
this region, there should be made the further detailed simulation with Comsol
software.
References
Battani A., Smith
T., Robinet J.C., Brulhet J., Lavielle B., Coelho D., 2011. Contribution of logging tools to understanding helium porewater data
across the Mesozoic sequence of the East of the Paris Basin. Geochimica et
Cosmochimica Acta 75, 7566–7584
Blaise T., Barbarand
J., Kars M., Ploquin F., Aubourg C., Brigaud B., Cathelineau M., El Albani A.,
Gautheron C, Izart A., Janots D.,
Michels R., Pagel M., Pozzi J.-P., Boiron M.C., Landrein P., 2014. Reconstruction of low temperature (<100 _C) burial in sedimentary
basins: A comparison of geothermometer in the intracontinental Paris Basin.
Marine and Petroleum Geology 53, 71-87.
Buschaert S., Giannesini
S., Benedetti L., Lavastre V., Gaucher E.C., Lacroix M., Lavielle B., Michelot
J.-L., France-Lanord C., Bourlès D., Finkel R., Lancelot J., Dewonck S.,
Vinsot A., 2006. Water geochemistry contribution to
the understanding of the regional hydrogeological system. Mém.
Soc. Géol. Fr. 178, 91–114.
Delay J., Trouiller
A., Lavanchy J.M., 2006. Propriétés hydrodynamiques du
Callovo-Oxfordien dans l'Est du bassin de Paris: comparaison des
résultats obtenus selon différentes approaches. C. R. Geosciences
338 (12–13), 892–907.
Fleck S., Michels
R., Izart A., Elie M., Landais P., 2001. Palaeoenvironmental
assessment of Westphalian fluvio-lacustrine deposits of Lorraine (France) using
a combination of organic geochemistry and sedimentology. International Journal
of Coal Geology 48, 65– 88.
Grathwohl P., 1998. Diffusion in natural porous media:
contaminant transport, sorption/desorption and dissolution kinetics. Springer
US 1, XVI, 207.
Guillocheau F.,
Robin C., Allemand P., Bourquin S., Brault N., Dromart G., Friedenberg R.,
Garcia J.P., Gaulier J.M., Gaumet F., Grosdoy B., Hanot F., Le Strat P.,
Mettraux M., Nalpas T., Prijac C., Rigollet C., Serrano O., Grandjean G., 2000.
Meso-cenozoic geodynamic evolution of the Paris Basin:
3D stratigraphic constraints. Geodyn. Acta13 (4), 189–246.
http://www.viscopedia.com/viscosity-tables/substances/water/
https://answers.yahoo.com/question/index?qid=20130623193455AA28HUi.
Kolesnichenko
E.A., Artemiev V.B., Kolesnichenko I.E.,
Lyubomischenko E.I., 2011. The natural laws of the methane in coal
seams. Book in russion, 75.
Landrein P.,
Vigneron G., Delay J., Lebon P, Pagel M., 2013. Lithologie, hydrodynamisme et
thermicité dans le système sédimentaire multicouche
recoupé par les forages Andra de Montiers-sur-Saulx (Meuse). Bull. Soc.
géol. France, t. 184, no 6, pp. 519-543.
Linard Y., Vinsot
A., Vincent B., Delay J., Wechner S., De La Vaissière R., Scholz E.,
Garry B., Lundy M., Cruchaudet M., Dewonck S., Vigneron G., 2011. Water flow in the Oxfordian and Dogger limestone around the
Meuse/Haute-Marne Underground Research Laboratory . Elsevier, Physics and
Chemistry of the Earth 36, pp.1450–1468.
Prinzhofer
A., Girard J., Buschaert S., Huiban Y., Noirez S., 2009. Chemical and isotopic
characterization of hydrocarbon gas traces in porewater of very low
permeability rocks: The example of the Callovo-Oxfordian argillites of the
eastern part of the Paris Basin. Elsevier Chemical Geology,
vol. 260, pp.269-277.
Rebeix R., Le Gal La
Salle C., Jean-Baptiste P., Lavastre V., Fourré E., Bensenouci F.,
Matray J.M., Landrein P., Shouakar-Stash O., Frape S.K., Michelot J.L.,
Lancelot J., 2014. Chlorine transport processes through
a 2000 m aquifer/aquitard system. Marine and Petroleum Geology 53,
102–116.