Экономические науки/2. Экономическая теория
Nurumbetova R., Ganyukova A.A.
The Karaganda
state university named after E.A. Buketov
Comparative
analysis of innovative economic activity of Kazakhstan and other countries
In conditions of independence and
reform of Kazakhstan's economy one of the key objectives is to improve the
innovation and the practical application of scientific and technological
achievements, to ensure product competitiveness in the world market.
Since the adoption
of the policy of industrial-innovative development in 2003, Kazakhstan at the
end of 2012 peaked in the growth of the main indicators of innovation. The
positive trend is largely due to the successful results of the State Program of
Forced Industrial-Innovative Development of Kazakhstan till 2014.
In 2012 relative to
2003, the share of innovation active enterprises increased from 2.1% to 7.6%.
Share of innovative active
enterprises, %
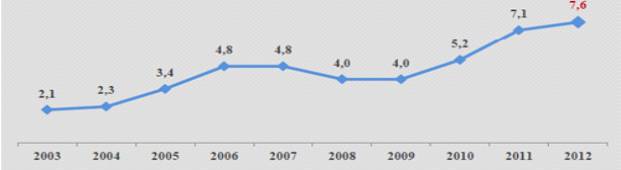
Source: Agency for Statistics
For comparison, the share of innovation
active enterprises in the United States is about 50%, among the countries of
the European Union have the highest rates of Germany (79.3%), Sweden (60%),
Finland (58%). The average for European Union countries up to about 53%.
Innovative activity of
enterprises, %
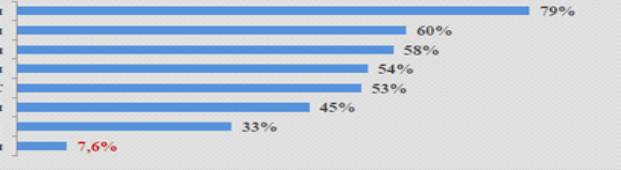
Source: Eurostat
Pocketbooks / Science, Technology and Innovation in Europe / 2013 edition
Spending on
research and development (hereinafter - R & D) is one of the main
indicators of innovation at the "input".
In 2011 the leaders on this indicator
were the United States (415 billion USD.), China (208.2 billion dollars.),
Japan (146.5 billion US dollars.).
Gross domestic expenditure on
research and development, mln tng
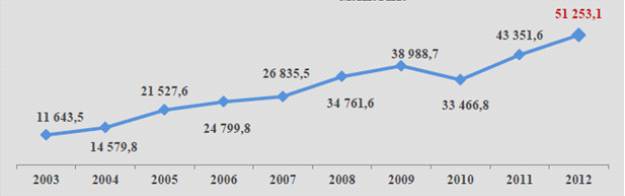
Source: OECD, Main
Science and Technology Indicators Database, July 2013, Statistics Agency, 2013
At the same time, it should be noted the
rapid growth INSIDE CAP costs on R & D in China, compared with 2008, this
figure increased by 1, 7 times.
The scale of
domestic spending on R & D Kazakhstan still lags behind technologically
advanced countries. However, the country is experiencing growth in domestic
expenditure on R & D in 2012, which amounted to 51.2 billion tenge with
growth of 18.2% compared to 2011 (43.3 bln).
The highest share of domestic
expenditure on R & D in GDP have Israel (4.38% of GDP), South Korea
(4.03%), Finland (3.78%), Japan (3.39%). It should be noted that, according to
the Strategy Europe 2020 one of the five main target indicators is to achieve
an increase in spending in the EU on R & D as a percentage of GDP to 3%.
In 2011, the average for the EU-28
amounted to 1.94%, which is higher than China (1.84%). Among EU member states,
one of the highest rates belong to Finland (3.78%).
The share of
expenses on R & D to GDP in Kazakhstan is still low - 0.17%, but it should
be born in mind that the domestic scientific system is in the process of
formation and development.
Thus, the innovative development of
Kazakhstan along with other factors hampered by shortage of staff capable of
managing innovation processes and projects. Overall, despite some positive
developments in the scientific field staff of the Science of Kazakhstan
requires effective government support and incentives.