Zvyagintseva O. S., Chernikova L.
I.
Stavropol
state agrarian University
Prediction
of the regional economic growth
The development potential of the region is realized in the future in the
form of investment activity and the overall regional growth, but this
realization occurs with a certain time lag. Thus, considering the potential
development of the region in the current period, expected changes in regional
development are possible only after a certain time.
Therefore, there is need to establish a causal relationship between the
development potential and key indicators of regional development (investments
in main capital per capita and gross regional product per capita). The
potential development is the cause of the inflows of investments into the
region and the growth of gross regional product. The article proposes a method
of establishing the relationship between the development potential of the
region and the main indicators of regional development, the main stages of
which are shown in Figure 1.
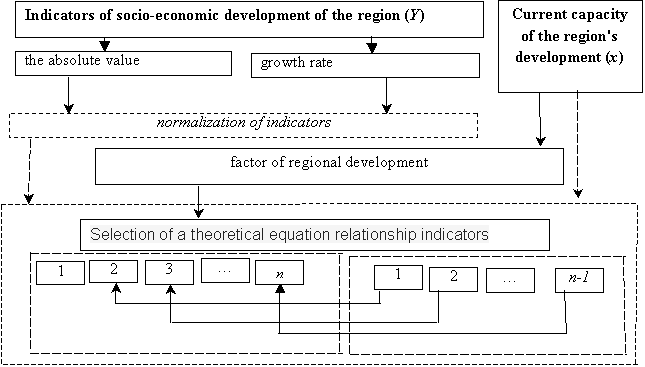
time lag
Figure 1 - Diagram analysis of the relationship
changes in the development potential of the region and regional development
factors
Correctly pick function connecting two arrays of data, allows regression
analysis, in which the determined nature of the relationship between the levels
of development potential of the region and investment in fixed capital (gross
regional product).
But total investment per capita in main capital and gross regional
product by themselves insufficiently characterize the level of investment
activity and the overall regional growth. In contrast, volume indicators, tempo
indicator is subject to little inter-regional differences in the specialization
of the regional economy. Therefore, the integration of volume and growth rates
of per capita indicators supplement
each other, allowing you to get a comprehensive assessment of regional
development. As a result, the studied parameters are normalized (standardized)
that enables regional comparisons further by the formula:
![]() , (1)
, (1)
where Xi - measure of the level of socio-economic development of the
i-th region; - The average value of the index, which characterizes the level of
socio-economic development of the region (in Russian or macro-region); TH p -
growth rate of indicators characterizing the level of social and economic
development of the region; - The average growth rate of indicators
characterizing the level of social and economic development of the region (in
Russian or macro-region).
The critical level of Crr is a unit. If the value of the index <1,
the level of socio-economic development of the region below the average level
(taken as a basis for calculation). If the value of Crr> 1 opposite the
level of economic development in the region above the average, and its growth
rate is significant.
The results of calculation of the indicators of regional development are
presented in Figures 2 and 3. In this way, you can see a clear distinction
between regions in terms of socio-economic development on the basis of the
computed criteria.
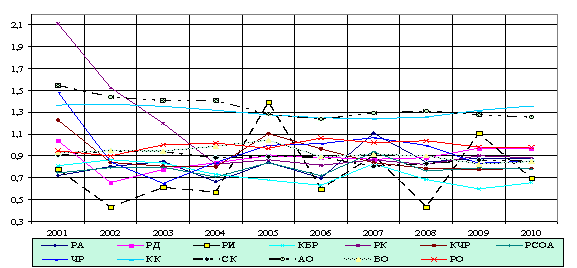
Figure 2 - The dynamics of the development of the
regions of Southern Russia (based on investments in fixed capital per capita)
In considering the first criterion clear leaders are Krasnodar and
Astrakhan region. Other regions have a level of coefficient within the unit
(with some exceptions). According to the second criterion the spread of the regions is several other - are
clearly distinguished leading regions (Krasnodar, Volgograd region, Rostov
region, Astrakhan and Stavropol Territory)
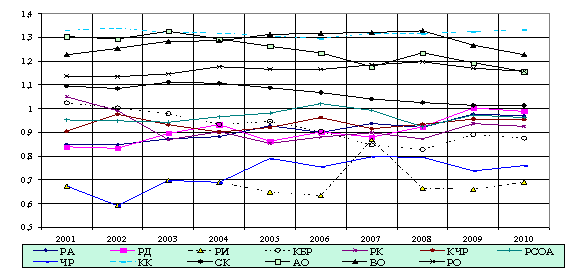
Figure 3 - The dynamics of socio-economic development
of the regions of Southern Russia (based on GDP per capita)
The value is calculated growth rate is greater than one. The lowest (but
not critical) levels have a criterion Republic of Ingushetia and the Chechen
Republic. This circumstance is due to a significant backlog level of GDP per
capita compared to the average level of the test macro.
Selection of a theoretical equation of the relationship-building factor
in the region and regional development was carried out taking into account the
time lag (1 to 3). The most accurate and adequate models for each time lag
selected based on three indicators: the correlation coefficient, the
approximation error and the F-test.
A detailed analysis of the regression (based on investments in fixed
capital) led to the following conclusions:
1. The maximum correlation coefficients,allowing talk about the close
relationship between the factor x (potential for the development of regional
socio-economic systems) and the function y (a factor of regional development
(based on investments in fixed capital per capita)) allow to opt for models
with built a lag of one year - for the Volgograd region (0.655), the Krasnodar
Territory (0.779), the Republic of Ingushetia (0.574) and the Republic of
Dagestan (0,809); with a lag of two years - for the Rostov region (0.785), the
Chechen Republic (0.734), the Republic of North Ossetia-Alania (0,399); with a
lag of three years - for the Republic of Kalmykia (0.760), the Astrakhan region
(0.690), Stavropol Territory (0.660), Kabardino-Balkaria Republic (0.860), the
Karachai-Cherkess Republic (0,777) and the Republic of Adygea (0.833).
2. The error of approximation is acceptable to all constructed models on
temporary lags.
3. F-criterion leads to the conclusion that all the constructed models
with a lag of three years can not be used to predict, because the quality of
these models has not been confirmed by comparison with the critical levels of
the index = 6.61 significance level f1 = 1 and f2 = 4. The exception is one
region - Kabardino-Balkar Republic. In other regression models the actual
levels of the indicator matches to critical levels (with two-year time lag =
5.99 and a time lag of one year = 5.59). In such a situation there is a need
for four of the studied regions to look for features that best describe
investigated the relationship of the development potential of regional
socio-economic systems by a factor of regional development (based on
investments in fixed capital per capita). Such models are selected by the
correlation coefficient. As a result, they lag impact of the development
potential of two years.
The final selected models the relationship between the development
potential of regional socio-economic systems and the coefficient of regional
development taking into account the time lag c satisfy all the conditions of
their accuracy, relevance and adequacy.
Thus, as a result of the analysis of the relationship and potential
regional growth factors, the following theoretical equation (tab. 1).
Table 1 - Results of construction of single-factor
regression model, the relationship of the development potential of the region
and factors of regional growth in Southern Russia
|
Name of region |
based GDP |
based investments in the fixed capital |
|
VO |
Yt
= 1,284 + 0,008 ∙ xt-1 |
Yt = 1,373 – 0,201 ∙ xt-1 |
|
RO |
Yt = 1,018 + 0,059 ∙ xt-1 |
Yt = 1,019 + 0,060 ∙ xt-1 |
|
KK |
Yt = 1,143 + 0,515
/ xt-1 |
Yt = 2,248 – 0,323
∙ xt-1 |
|
CHR |
Yt = 0,855
– 0,057 / xt-1 |
Yt = 0,819 - 0,030 /
xt-1 |
|
RSOA |
Yt = 0,839 + 0,072 ∙ xt-1 |
Yt = 0.,839 + 0.073 ∙ xt-1 |
|
KCHR |
Yt = 1,108
∙ 0,867 xt-1 |
Yt = 0,898 +
0,112 / xt-1 |
|
RK |
Yt = 0,835 + 0,060 / xt-1 |
Yt =
0,835 + 0,060 / xt-1 |
|
KBR |
Yt = 1,222 –
0,225 ∙ xt-1 |
Yt = 1,223 – 0,225 ∙ xt-1 |
|
RI |
Yt = 0,919 – 0,301 ∙ xt-1 |
Yt = -0,992 + 1,30 / xt-1 |
|
RD |
Yt = 0,722 + 0,076 ∙ xt-1 |
Yt = 0,139 + 0.313 ∙ xt-1 |
|
AO |
Yt = 1,463 – 0,352 ∙ xt-1 |
Yt = 0,224 + 3,866
∙ xt-1 |
|
SK |
Yt = 1,276 – 0,102 ∙ xt-1 |
Yt = 1,277 - 0,102 ∙ xt-1 |
|
RA |
Yt = 0,722 + 0,076 ∙ xt-1 |
Yt = 0,829 + 0,11 / xt-1 |
As a result of the constructing of the presented models in the Table the
relationship of development potential of the region and the most important
indicators of regional development confirmed their relationship. Moreover, this
provision is valid for both current and for future periods.
The use of this technique makes it possible to measure the speed of
perception of the existing potential of the regional economy as a whole, which
is defined as the reciprocal of the period of performance of the local index of
regional development. The grouping of regions of the South of Russia on the
development potential of this relationship, and the speed of its perception of
the Territory's economy is presented in the table number 2.
Table 2 - The grouping of regions of Southern Russia
at the speed of perception of the development potential of the regional economy
as a whole
|
The grouping of regions by the current development potential |
for investments in fixed capital per capita |
GDP per capita |
||||
|
speed of perception |
speed of perception |
|||||
|
1 |
0,5 |
0,33 |
1 |
0,5 |
0,33 |
|
|
High |
VO, КК, |
RO, SK |
- |
VO, КК, |
RO, SK |
- |
|
Average |
RD |
RSOA, AO, RA |
KBR |
RD, AO,
RA |
RSOA |
KBR |
|
Low |
RI |
CHR, KCHR,
RK |
- |
CHR, RI,
KCHR |
RK |
- |
The resulting regression models are built taking into account the time
lag, allow to determine on the basis of pre-existing forecasts, strategic
development potential as the level of regional development in the long term
(Table. 3).
As a result, the authors determined that in five regions of the South of
Russia in the forecast period, the growth rate of investment in fixed capital
slowed down, due to insufficient investment.
In turn, this fact is explained by a low level of capabilities in the
region and significant restrictions on their development. As a result of those
regions in the short term will not be able to provide high levels of
socio-economic development. In other regions the growth rate of investment in
fixed capital in the forecast period are increased (with the exception of the
Volgograd Region, Rostov and Astrakhan region).
Table 3 - Results of the forecast factors of regional
growth
|
Name of of the region |
The coefficient the regional growth |
|||
|
based on investments in the fixed capital |
based on GRP |
|||
|
prognosis |
prognosis |
|||
|
2011 |
2012 |
2011 |
2012 |
|
|
VO |
0,933 |
0,932 |
1,301 |
1,302 |
|
rate of growth, % |
109,92 |
109,80 |
106,08 |
106,08 |
|
RO |
1,154 |
1,153 |
1,151 |
1,150 |
|
rate of growth, % |
117,87 |
117,80 |
99,45 |
99,39 |
|
КК |
1,372 |
1,375 |
1,333 |
1,334 |
|
rate of growth, % |
100,94 |
101,20 |
100,05 |
100,11 |
|
CHR |
0,773 |
0,775 |
0,768 |
0,772 |
|
rate of growth, % |
90,58 |
90,82 |
101,06 |
101,57 |
|
RSOA |
0,744 |
0,748 |
0,936 |
0,933 |
|
rate of growth, % |
95,30 |
95,80 |
97,26 |
96,89 |
|
KCHR |
0,724 |
0,723 |
0,946 |
0,947 |
|
rate of growth, % |
92,30 |
92,10 |
99,04 |
99,18 |
|
RK |
0,910 |
0,914 |
0,910 |
0,914 |
|
rate of growth, % |
103,01 |
103,54 |
98,32 |
98,82 |
|
KBR |
0,603 |
0,605 |
0,919 |
0,922 |
|
rate of growth, % |
91,97 |
92,26 |
104,89 |
105,23 |
|
RI |
0,831 |
0,855 |
0,704 |
0,707 |
|
rate of growth, % |
119,64 |
123,00 |
101,96 |
102,36 |
|
RD |
0,797 |
0,800 |
0,882 |
0,883 |
|
rate of growth, % |
82,67 |
82,99 |
89,25 |
89,33 |
|
AO |
1,295 |
1,291 |
0,989 |
1,002 |
|
rate of growth, % |
103,20 |
102,86 |
85,56 |
86,66 |
|
SK |
0,918 |
0,919 |
1,088 |
1,089 |
|
rate of growth, % |
107,80 |
107,90 |
107,41 |
107,51 |
|
RA |
0,937 |
0,940 |
0,799 |
0,797 |
|
rate of growth, % |
107,47 |
107,81 |
82,46 |
82,25 |
Forecast of Regional Development of GDP per capita also allows you to split the region into two
groups: developing in accordance with the high levels of existing capacity and
not able to normal development, due to the dominance of the limitations in the
development of the existing opportunities.
Thus, in the process of research was proved the presence of the
dependence between the development potential of the region and regional
development indicators such as fixed investment and GDP per capita. The
resulting production functions fully approximated the original data of the
entire range of changes.
Literature:
1.
Nazarenko A., Zaporozhets D., Sergienko E. Features of innovative activity
motivation in enterprise structure / A. Nazarenko, D. Zaporozhets,
E. Sergienko // In the collection:Social and economic innovations: trends, forecasts and
perspectives
conference proceedings of the Ist International Conference. Russian State
Social University (Stavropol branch); under the editorship of PhD, associate
professor O. Yu. Kolosova, PhD, senior lecturer K. V. Bagmet, assistent K. A.
Andikaeva. 2015. С. 160-164.
2. Eremenko N.V., Sidorova D.V., Orel J.V. Historical and geographical
region investment potential Stavropol RF / N.V. Eremenko, D.V. Sidorova., J.V. Orel
// Scientific works SWorld. 2015. Т. 18. № 1 (38). С. 69-71.
3. Bannikova
N.V., Baydakov A.N., Vaytsekhovskaya S. S. Identification of strategic alternatives
in agribusiness / N.V. Bannikova, A.N Baydakov., S.S.
Vaytsekhovskaya Modern Applied Science. 2015. Т. 9. № 4. С. 344-353.