The honored science and education member of the RANS,
corresponding-member of the IAS of HS, Dr.S. (eng.). Professor, Pil E.A. Russia, Saint-Petersburg,
Saint-Petersburg State Marine Technical University
BUILDING LIMITS OF EXISTENCE AREA OF A
HEALTHY OR A DISEASED BODY WITH USE OF THE MS EXCEL PROGRAM
Every medical book
always mentions a healthy and a diseased body, but there is no specific mention
of the limits within which a healthy body exists. The limits are understood as
any specific numeric values of one or several parameters according to which we
can make a respective conclusion. This article deals with the issue of
calculation of existence limits of both a healthy and a diseased body with the
use of the MS Excel program and is based on the analysis of results of
experimental research done in the cancer biophysics laboratory where the
researchers studied the effect of different actions (Table 1) on 32
factors.
Table 1. Types
of actions on study groups
|
№ |
Type of action |
|
1. |
Control (without tumor) with no action |
|
2. |
Injection of a chemotherapeutic agent intramuscularly (i.m.) |
|
3. |
Injection of a chemotherapeutic agent (i.m.) + adrenalin |
|
4. |
Injection of a chemotherapeutic agent into the lymph node (into ln) |
|
5. |
Injection of a chemotherapeutic agent (into ln) + magnetic field |
|
6. |
Injection of a chemotherapeutic agent intramuscularly (i.m.) |
|
7. |
Control + normal saline solution (to group 2) |
|
8. |
Control + adrenalin (to group 3) |
|
9. |
Control + magnetic field (to groups 5 and 6) |
|
10. |
Control (tumor without action) (to groups 2 to 9) |
|
11. |
Control (without tumor) + chemotherapeutic agent (i.m.) |
Out of these 32 factors
we took 24 presented in Table 2 based on which we built the existence areas of
a healthy and a diseased body in relation to variable Х15, NADP of cortex (as
it has a relatively big difference between the maximum and the minimum values
of the correlation coefficient) with the use of the REGRESSION program [1, 2].
Table 2. Factors
studied
|
№ |
Variables |
Title |
|
1. |
Х15 |
NADP of cortex |
|
2. |
Х3 |
Weight of thymus per 100 g of animal mass |
|
3.
|
Х4 |
Average surface of adrenal cortex |
|
4.
|
Х5 |
Average surface of adrenal medulla |
|
5.
|
Х6 |
Total cells in the standard surface of cortex |
|
6.
|
Х7 |
Percentage of small lymphocytes in the standard surface of cortex |
|
7.
|
Х8 |
Percentage of middle lymphocytes in the standard surface of cortex |
|
8.
|
Х9 |
Number of macrophages in cortex |
|
9.
|
Х10 |
Total cells in the standard surface of adrenal medulla |
|
10.
|
Х11 |
Percentage of small lymphocytes of adrenal medulla |
|
11.
|
Х12 |
Percentage of middle lymphocytes of adrenal medulla |
|
12.
|
Х13 |
RNA/DNA of thymus of cortex |
|
13.
|
Х14 |
NAD of cortex |
|
14.
|
Х16 |
NADPH+ of cortex |
|
15.
|
Х17 |
NADP of cortex |
|
16.
|
Х18 |
Succinate dehydrogenase of cortex |
|
17.
|
Х19 |
Lactate dehydrogenase of cortex |
|
18.
|
Х20 |
Volume of cores of cortex thymocytes |
|
19.
|
Х21 |
Volume of adrenal medulla thymocytes |
|
20.
|
Х23 |
RNA/DNA of adrenal medulla |
|
21.
|
Х24 |
NADPH+ of adrenal medulla |
|
22.
|
Х25 |
NADP of adrenal medulla |
|
23.
|
Х26 |
Succinate dehydrogenase of adrenal medulla |
|
24.
|
Х27 |
Lactate dehydrogenase of adrenal medulla |
Table 3 below shows resulting correlation coefficients
R2 placed in a way that from number 1 to 12 they ascend, and from 13
to 23 descend. On the basis of these data there was built a curve 1 (dashed
line) presented in Fig. 1 and Fig. 2. The next Table 4 shows the maximum and
minimum deviations of correlation coefficients R2 from a healthy
body for a group of a chemotherapeutic agent. The tables created this way had a
number of unfilled cells which is due to these values being absent. In such
cases where there was only one value for +R2 or -R2 it was inserted into cell +R2min
or -R2max. That said, there may be points and
even areas where curves of a diseased body are tangent to the curve of a
healthy body by one or several factors, i.e. when for certain reasons we cannot
deduce the limits of a diseased body. These areas were given the name of “areactive
zones” in medicine.
Table
3. Correlation coefficients R2t for variable Х15 in ascending and descending order for thymus
|
№ |
Variables |
R2a |
№ |
Variables |
R2a |
|
1 |
Х7 |
0,203 |
13 |
X5 |
0,796 |
|
2 |
X16 |
0,367 |
14 |
X11 |
0,747 |
|
3 |
X19 |
0,391 |
15 |
X20 |
0,716 |
|
4 |
X21 |
0,435 |
16 |
X27 |
0,665 |
|
5 |
X26 |
0,524 |
17 |
X25 |
0,630 |
|
6 |
X14 |
0,614 |
18 |
X4 |
0,624 |
|
7 |
X18 |
0,625 |
19 |
X13 |
0,524 |
|
8 |
X8 |
0,658 |
20 |
X17 |
0,493 |
|
9 |
X24 |
0,680 |
21 |
X23 |
0,404 |
|
10 |
X12 |
0,742 |
22 |
X10 |
0,367 |
|
11 |
X3 |
0,747 |
23 |
X6 |
0,259 |
|
12 |
X9 |
0,898 |
|
|
|
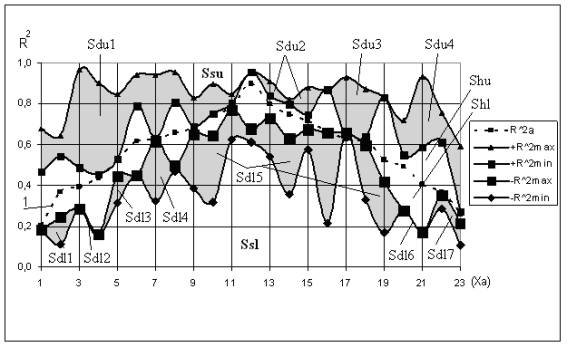
Fig. 1. Dependence R2 = f(Xi) for thymus during
chemotherapy
Here:
·
+R2max - the maximum value of the correlation coefficient of a
diseased body R2d differing from that of a healthy body R2h
upwards;
·
+R22min - the minimum value of
the correlation coefficient of a diseased body R2d differing from
that of a healthy body R2h upwards;
·
-R2max - the maximum value of
the correlation coefficient of a diseased body R2d differing from
that of a healthy body R2h downwards;
·
-R2min - the minimum value of the correlation coefficient of a
diseased body R2d differing from that of a healthy body R2h
downwards.
In other words, all +R2max and
+R2min values are placed above curve 1 while all -R2max
and -R2min values are placed below curve 1.
On the basis of Table
4 we built Fig. 1 which shows that the whole zone can be divided into the
following five areas: Ssu and Ssl are the upper and the lower areas where even
a diseased body cannot exist; Sdu and Sdl are the upper and the lower areas of
a diseased body (in Fig. 1 and Fig. 2 they are marked in grey); Shu is the
existence area of a healthy body placed above curve 1; Shl is the existence
area of a healthy body placed below curve 1.
Thus, we can note down the following
formula (1)
Stl = Ssu + Sdu +Shu + Shl + Sdl + Ssl. (1)
However, as the upper
part of a diseased body Sdu consists of 4 parts, i.e. Sdu1, Sdu2, Sdu3, Sdu4, hence
it can be represented by the following formula (2) (ref. Fig. 1)
Sdu = Sdu1 + Sdu2 + Sdu3 + Sdu4. (2)
Similarly to the upper part Sdu, the lower
part of a diseased body Sdl is calculated according to the formula (3)
Sdl = Sdl1 + Sdl2 + Sdl3 + Sdl4 + Sdl5 +
Sdl6 + Sdl7. (3)

Fig. 2. Dependence for thymus for control
Calculations
completed for these areas showed that they have the following surface values:
Ssu = 3,109 unit2, (14,132%); Sdu
= 3,967 unit2, (18,032%); Shu
= 2,009 unit2, (9,716%); Shl
= 2,138 unit2, (9,716%); Sdl
= 3,048 unit2, (13,85%); Ssl
= 7,73 unit2, (35,13%). As we see from the calculations presented, a
healthy body can have the surface of Sh = 7,73 unit2, (35,13%), a
diseased body has the surface of Sd =
7,015 unit2, (31,89%), and the area where neither a healthy, nor a
diseased body can exist (Ssu + Ssl) makes 10,839
unit2, (49,266%).
Similar calculations were made for the group of a
healthy body for control + a chemotherapeutic agent. The data received are
presented in Table 5 and on the basis of these data we built Fig. 2. Here we
deduced the following values of the surfaces: Ssu = 6,057 unit2, (27,53%);
Sdu = 1,781 unit2, (8,095%); Shu
= 1,248 unit2, (5,67%); Shl = 1,884 unit2, (8,564%);
Sdl = 2,864 unit2, (13,02%); Ssl = 8,167 unit2, (37,12%%).
That said, a healthy body has
the surface of Sh = 3,132 unit2, (14,234%), a diseased body has the surface
of Sd = 4,645 unit2, (21,114%), and the area where neither a healthy, nor a diseased body can exist
(Ssu + Ssl) makes 14,224 unit2, (64,652%) [3].
Table 4. Maximum and minimum deviations of the correlation coefficient R2
from a healthy body for the group of a chemotherapeutic agent
|
№ |
Variables |
R2a |
+R2max |
+R2min |
-R2max |
-R2min |
|
1 |
Х7 |
0,203 |
0,679 |
0,467 |
0,180 |
- |
|
2 |
X16 |
0,367 |
0,644 |
0,543 |
0,245 |
0,113 |
|
3 |
X19 |
0,391 |
0,968 |
0,488 |
0,284 |
- |
|
4 |
X21 |
0,435 |
0,900 |
0,455 |
0,162 |
- |
|
5 |
X26 |
0,524 |
0,849 |
0,528 |
0,448 |
0,312 |
|
6 |
X14 |
0,614 |
0,942 |
0,791 |
0,450 |
- |
|
7 |
X18 |
0,625 |
0,943 |
0,632 |
0,615 |
0,324 |
|
8 |
X8 |
0,658 |
0,956 |
0,805 |
0,502 |
0,468 |
|
9 |
X24 |
0,680 |
0,832 |
0,691 |
0,650 |
0,383 |
|
10 |
X12 |
0,742 |
0,898 |
0,754 |
0,646 |
0,318 |
|
11 |
X3 |
0,747 |
0,848 |
0,803 |
0,770 |
0,623 |
|
12 |
X9 |
0,898 |
- |
0,954 |
0,777 |
0,611 |
|
13 |
X5 |
0,796 |
0,909 |
0,838 |
0,729 |
0,540 |
|
14 |
X11 |
0,747 |
0,823 |
0,799 |
0,633 |
0,354 |
|
15 |
X20 |
0,716 |
0,882 |
0,746 |
0,675 |
0,575 |
|
16 |
X27 |
0,665 |
- |
0,869 |
0,657 |
0,213 |
|
17 |
X25 |
0,630 |
0,929 |
0,640 |
- |
- |
|
18 |
X4 |
0,624 |
0,873 |
0,641 |
0,597 |
0,329 |
|
19 |
X13 |
0,524 |
- |
0,829 |
0,416 |
0,169 |
|
20 |
X17 |
0,493 |
0,718 |
0,551 |
0,276 |
- |
|
21 |
X23 |
0,404 |
0,934 |
0,586 |
0,168 |
- |
|
22 |
X10 |
0,367 |
0,756 |
0,611 |
0,351 |
0,284 |
|
23 |
X6 |
0,259 |
0,591 |
0,273 |
0,213 |
0,107 |
Table 5. Maximum and minimum deviations of
the correlation coefficient R2 from a healthy body for control + a
chemotherapeutic agent
|
№ |
Variables |
R2a |
+R2max |
+R2min |
-R2max |
-R2min |
|
1.
|
Х7 |
0,203 |
0,551 |
0,299 |
- |
- |
|
2.
|
X16 |
0,367 |
0,806 |
0,398 |
0,254 |
- |
|
3.
|
X19 |
0,391 |
0,769 |
0,452 |
0,384 |
- |
|
4.
|
X21 |
0,435 |
0,810 |
0,479 |
- |
- |
|
5.
|
X26 |
0,524 |
0,922 |
0,662 |
0,338 |
- |
|
6.
|
X14 |
0,614 |
- |
0,665 |
0,439 |
0,432 |
|
7.
|
Х18 |
0,625 |
- |
0,638 |
0,169 |
- |
|
8.
|
Х8 |
0,658 |
- |
0,722 |
0,635 |
- |
|
9.
|
Х24 |
0,680 |
- |
0,768 |
0,665 |
0,437 |
|
10.
|
Х12 |
0,742 |
- |
0,845 |
0,734 |
0,452 |
|
11.
|
Х3 |
0,784 |
- |
0,793 |
0,771 |
0,469 |
|
12.
|
Х9 |
0,898 |
- |
- |
0,877 |
0,344 |
|
13.
|
Х5 |
0,796 |
- |
0,878 |
0,762 |
0,499 |
|
14.
|
Х11 |
0,747 |
- |
- |
0,729 |
0,321 |
|
15.
|
Х20 |
0,716 |
- |
0,843 |
0,712 |
0,425 |
|
16.
|
Х27 |
0,665 |
0,773 |
0,735 |
0,336 |
- |
|
17.
|
Х25 |
0,630 |
- |
0,711 |
0,542 |
0,346 |
|
18.
|
Х4 |
0,624 |
0,784 |
0,693 |
0,340 |
- |
|
19.
|
Х13 |
0,524 |
- |
- |
0,475 |
0,220 |
|
20.
|
Х17 |
0,493 |
0,749 |
0,539 |
0,486 |
0,410 |
|
21.
|
Х23 |
0,404 |
- |
0,462 |
- |
- |
|
22.
|
Х10 |
0,367 |
- |
0,368 |
0,317 |
0,312 |
|
23.
|
Х6 |
0,259 |
- |
0,386 |
0,251 |
0,207 |
Note:
1. All experiments were made by Professor
E.A. Sheyko, Rostov-on-Don, Russia.
2. All calculations were made by Professor
E.A. Pil, St.-Petersburg, Russia.
BIBLIOGRAPHY
1. E.A. Pil, E.A. Sheyko. Analysis of Regression Dependences Found While
Studying the Parameters of Blood and Thymus / Saint Petersburg Institute of
Fine Mechanics and Optics. – 16 p., illustrated. – References: 1 title – Rus.
Dep. in VINITI 07.12.93. N3037–В93
2. E.A. Pil, E.A. Sheyko. Use of a Personal
Computer in Experimental Oncology / Oncology Problems. – 1993. – N3. – pp. 92–94
3. E.A. Pil, E.A. Sheyko. Defining the
Existence Limits of a Healthy and a Diseased Body Based on the Analysis of
their Correlation Coefficients, Saint Petersburg, REMO&Со, Saint Petersburg, 1997. – 19 p., illustrated.