УДК 574.9:57.045
PhD in Technical
Sciences Zviagintseva А.V.
Donetsk National Technical University, Ukraine
Biological diversity: the problem of modeling the
distribution of species on the Earth
Introduction. Biodiversity is a
unique feature of nature that connects with the creation of the structural and
functional organization of ecological systems. In the last
years, the problem of preserving the diversity of organisms reached the level
of global concern and poses a number of complex tasks in the field of
environmental research studies. Biodiversity monitoring connected with the
biosphere monitoring system and the development of species diversity databases
as well as with the analysis of development trends and patterns of biological
life on Earth. Nowadays different types of human activities have led to the
extinction of many species and ecosystems in the biosphere. Here lies one of
the major environmental risks associated with the humankind development.
Modern biodiversity problems. Most often, when
speaking about the biodiversity it implies species diversity. The number of
species according to different sources varies from 5 to 100 million [1, 2, 3]. At the same time, the taxonomic affiliation in accordance
with modern classification is set to only 2 million species: 500
thousands plant species and 1.5 million species of animals [1].
The
process of the evolution of life has always been associated with the extinction
of biological organisms, populations and species in general. It is believed
that average life expectancy of one species is about 5 - 6 million years. The
process of the evolution of life has always been associated with the extinction
of biological organisms, populations and species in general. It is recognized,
that average life expectancy of one species is 5 - 6 million years. Over the
past 200 million years we have lost about 900 thousand species of flora and
fauna, or an average of less than one species per year [3]. This means that the
extinction of species has always been a natural and necessary process of
evolution – more than 99% of species that ever existed have become extinct
(Leakey 1996), but it is assumed that species are disappearing today at 100 – 1 000 times faster than before the
human existence (Chapin et al. 1998). Experts estimate that over the next 20 –
30 years 25% of the Earth's biodiversity will be under serious threat of
extinction, nearly 40 000 species will probably disappear. According to the researchers,
biodiversity restores very slowly: in 1000 endangered species appears only one
new species (Chapin et al. 1998). This burst of extinction last time was 65
million years ago, since the end of the Cretaceous period, when the dinosaurs
disappeared (Meadows et al., 1992, [4]).
According to
paleontologists, over the past 500 million years on Earth, there were five
periods of mass extinction. To restore the biological wealth each time had to
be about 10 million years [4]. During our era, there is a real danger of a new
period of mass loss of biological diversity. The prediction of the risk of
process development requires knowledge of biodiversity patterns.
Some principles of modeling
biodiversity. The first data from studies that examined the biodiversity impact
assessment to ecosystem processes have been published only in the early nineties
of the XX century. Since then the amount of research in this area has increased
significantly. Over a period of 25 – 30 years, since the scientific community expressed
the danger of biodiversity loss, it is difficult to assess the evolution processes,
which the time of the observation changes in thousands of years
Back in
the 30's of last century, the famous Russian scientist V.A. Kostitsyn
conceptually proposed an approach that allows building a model of the species
distribution on Earth to assess the sustainability of life [6]. This idea has
remained unrealized since at that time it was impossible to implement the
information models, covering a huge amount of numerical and graphical data.
Models of species are one of the main tools for constructing the life evolution
theory on Earth, which in essence would have a theoretical rather than a
narrative framework. The basic problem in this area – how to build information
resources that would provide data from biological parameters and prevalence of hundreds
of thousands species. Obviously, this problem cannot be solved without the usage
of information technology.
Today
biodiversity assessment is based on a variety of indices, which differ in both
ways: in how they are determined, and the methodological principles of their
construction. Hypotheses, which are the basis of species distribution models
usually are private and cannot serve as a basis for quantitative methods of
biodiversity assessment, because ecological systems cannot be assessed at a one,
though and complex indicator. In order to construct quantitative models of
biodiversity we need to develop scales measuring the prevalence of species that
would not have been basically subjective. Nowadays such type of systems in the
ecology with a quantitative assessment doesn't exist. Studies show that
biodiversity assessment by using different indexes often leads to contradictory
conclusions, which are a consequence of subjective perceptions of researchers
[8].
In
order to assess the ecosystems biodiversity it requires a certain criterion (or
set of criteria), which is likely to have a probabilistic base. Several authors
believe that the most important characteristic is the diversity index of
evenness of the abundance of species, reflecting the structure of an ecological
community and showing the absence of the dominant species. It is believed that
the ecological system is a high quality system in terms of biodiversity, only
if it differs from others by the abundance of species and the highest rate of
equalization. Ecological system, that has rich species diversity, must satisfy
the following criteria:
-
has a high indicator of species abundance (number of species per unit
area);
-
differ with uniform probability distribution for the number of
individuals of each species;
-
has similar levels of probability density function for each type of
species.
The
question of whether such environmental system is optimal from the point of view
of biological evolution is debatable. However, it can be accepted as a basic
model to compare different ecosystems in relation to this system by the
criteria of biodiversity. This idea can form the basis of a criterion that
takes into account the probabilistic nature of biodiversity. However, this is
possible only if probabilistic models of
biological diversity will be built for taxonomic groups - orders, families,
etc.
Statement of the problem. The
study of biodiversity issues related to necessity of studying the habitats of
species, their ecological and morphological characteristics, patterns of
distribution according to various indicators of the dynamics of evolution.
Priority way is to study the structural features of communities in specific
environmental conditions with taking into account their species composition,
abundance, life expectancy and other parameters. Without generalizing the data
set describing biodiversity, it is impossible to establish the rules of
biological evolution of life on Earth.
In order to create a global model of
biodiversity, it is necessary to work out the methodological principles of
research. Obviously, the construction of global models is impossible without
the development of information systems that will enable a set of tools for the
researcher to establish and analysis patterns.
The aim of this work is to develop GIS models of
biodiversity and establish trends and evolution of species, as well as obtaining
the probability rules of species distributions.
The
object of study is the most common suborders of Muridae and Sciuromorpha of the
most numerous groups of mammals - rodents, and also the primates. For these
groups, there is a wealth of information in the form of the World database
(DB).
Suborder
Muridae of order Rodentia is one of the major taxonomic groups of units among
mammals, it includes more than 1,000 species of 10 existing families and three extinct. The representatives of the
suborder Muridae have been introduced worldwide.
The
term Sciuromorpha has referred to numerous groups of rodents, but the only
family common to all variations is the Sciuridae, the squirrels. Most
definitions also include the Mountain Beaver. Well-adapting to different
conditions of life, the group also has mastered almost all climatic zones of
the Earth.
Members
of the order Primates - prosimians and simians form a diverse group with
complex forms of social organization. Most primate species live in tropical
rain forests. The group includes 356 species of 11 families [2].
Muridae
Suborder is convenient as modeling object for the analysis and evaluation of
the diversity of living conditions. Life rodent populations are indicators of
the environment. Muridae are considered as a valuable biological model, as well
as interest in epidemiological studies and have an important place in the food
chain.
Suborder
Sciuromorpha used because of the fact that they have a wide distribution area
and they are an ancient species of mammals.
Suborder of primates is the highest form of animal in the evolutionary
chain. The human is also the unit of it.
The development of GIS. Based on collected
data a structured information system was built which includes a variety of
numerical indicators and contains GIS models of species distribution Muridae,
Sciuromorpha and Primates, as well as photographs of individuals of the studied
species. Quantitative indicators include information to indicate the average
life expectancy, body temperature, weight, and size of the animals, the number
of litters, the interval between litters, length of pregnancy, lactation,
metabolic rate, etc. - about 30 indicators for each of the approximately
1 500 species . The total number of entry in the database is about
50 000. During the data collection there was released the search of
mapping information with images of studied habitats species, and also was made
the digitizes of this areas. The method used for processing graphic data is a
step by step process of digitizing raster images and process them: defining the
boundaries of regions and areas of polygons.
To create a
database, statistical and graphical data processing was used system MapInfo,
which combines the advantages of processing information held by the database
(including the query language SQL), and clarity of maps, lists, and charts.
Established GIS is presented in Figure 1.
|
|
|
|
|
Figure 1. – Example
representation of a habitat distribution of species |
||
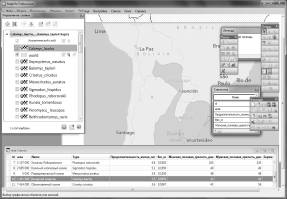
Over 2 000 maps were processed in total that contain the
information on the spread of Muridae, Sciuromorpha and Primates on Earth.
Probabilistic patterns of
biodiversity for the studied biological groups. According to the collected data,
we can estimate the probability distribution of the species studied. To do
this, we have to use geometric probability, which is the ratio area habitat of
each species to the area of the land of the earth's surface. Next, the rules of
probability are sought as dependencies between geometric probabilities and
various biological parameters of each group or climatic indicators of the
environment. For this purpose we used a typical method of estimating the
probability of events, which is widely used in biological sciences. This
methodology based on the methods of probit analysis was developed in the
twentieth century by the famous entomologist Chester Bliss [7]. Numerous
experimental data obtained in toxicology, entomology, microbiology, ecology,
etc. show that the relationship between the proportion of individuals who are
observed with some of the effects, for example the negative, and the amount of
exposure, such as dose, expressed in a probability curve that has an S-shape.
Usually, the transformation of the curve to a straight line includes next: on
the abscissa axis there are logarithms doses, and the ordinate axis - the
probabilistic one, the so-called probits. In the biological sciences, and
security systems, probit is determined according to the equation:
 , (1)
, (1)
where ![]() – const,
– const, ![]() – biological
parameters or characteristics of the environment;
– biological
parameters or characteristics of the environment; ![]() – statistical or
geometric probability.
– statistical or
geometric probability.
Data
processing technique involves finding connections between the probability
distribution of the species and the most important parameters (weight, life
expectancy, body temperature, etc.) in the form of equations (1).
As a non-dimensional characteristics associated with biological
parameters during the links search was selected geometric probability
distribution of these parameters. It is known that for one-dimensional
geometric random variable the probability is finding according to the equation:
 , (2)
, (2)
where
![]() – some
biological parameter or characteristic of the environment;
– some
biological parameter or characteristic of the environment; ![]() ,
, ![]() – accordingly
the maximum and minimum value for this parameter in the group of all the
studied order (suborder).
– accordingly
the maximum and minimum value for this parameter in the group of all the
studied order (suborder).
From
the collected data we can estimate the probability of distribution of each
species ![]() . For this goal we can use, as
previously mentioned, the ratio of the habitat area of each species to the land
area of the earth's surface.
. For this goal we can use, as
previously mentioned, the ratio of the habitat area of each species to the land
area of the earth's surface.
The
statistical probability of the species existence W with a certain biological
parameters (e.g., life expectancy and body weight) can be found from:
![]() , (3)
, (3)
where
![]() – the number of
species in which there is a certain biological parameters less than specified
values;
– the number of
species in which there is a certain biological parameters less than specified
values; ![]() – total number
of all species from studied order (suborder).
– total number
of all species from studied order (suborder).
Consider
the more detail the results of experiments established for the suborder
Muridae, which were obtained on the basis of the above methodology.
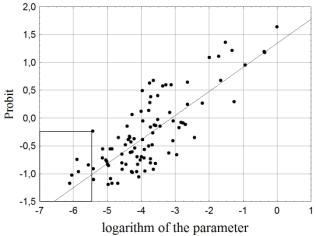
For
example, in Figure 2, the number of species characterized by the number of
points in the highlighted area in the figure, and the total number of species
characterized by the number of observed data points.
|
|
|
When analyzing the data with the most significant relationships of
statistical probability of the existence was set with intensity of
metabolism, as well as with life expectancy in captivity and an average weight of an individual. The analysis of
dependencies for Muridae are presented in Figures 3 and 4. |
|
Figure 2. – Dependence
probability of species existence from a parameter |
|
|
|
|
|
|
Figure 3 – Dependence
probability of species existence from the metabolism intensity |
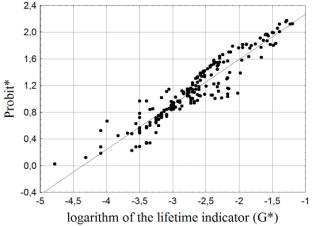
|
Figure 4. – Dependence
probability of species existence from life expectancy
in captivity: |
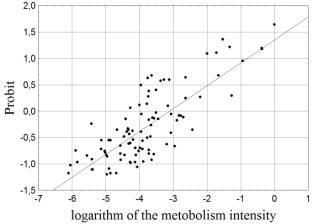
It was found that dependence probability of species existence from
the metabolism intensity for Muridae
has the next form:
![]() , (4)
, (4)
where  ;
; ![]() – metabolism intensity (W).
– metabolism intensity (W).
The
correlation coefficient was based 0,78.
On the other hand the statistical probability dependence of species existence
of Muridae from life expectancy in captivity and the average weight of an
individual is:
![]() , (5)
, (5)
where  ,
,  ,
, ![]() – life expectancy in captivity (years);
– life expectancy in captivity (years); ![]() – average weight of an individual (kg). The
correlation coefficient was based 0,94.
– average weight of an individual (kg). The
correlation coefficient was based 0,94.
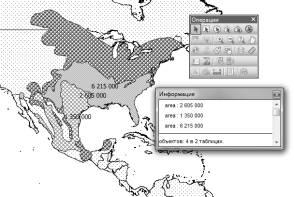
Based
on the value of the habitats area of species were found geometric probabilities
by dividing the space areas to the area of the earth's land surface, which is
equal to 148940000 km2. When analyzing the data most significant relationships
of probability species distribution were established with a body temperature of
a species (Figure 5).
|
|
|
The probability dependence of species distribution Muridae from body
temperature has the form:
where
|
|
|
|
Figure 5. – Dependence probability of species existence from
a body temperature |
|
|
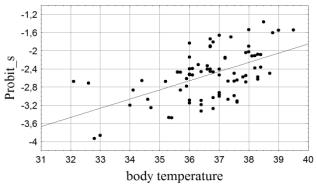
This
dependence is significant since the correlation coefficient was based 0,5.
From these results it can be concluded that the habitats area
distribution is greater in area for those species which body temperature of individuals
is higher.
In the similar way, we obtained the dependencies for suborder
Sciuromorpha and for Primates.
Since
there is a relationship between the probability distribution of the species and
its temperature for Muridae, suborder Sciuromorpha
and for Primates, it is natural to assume the existence of the
probability species distribution due to climate indices. Therefore the possible
direction for future research could be the development of models aimed to the
search for patterns species distribution for studied groups (suborders), that
are depending on the climatic parameters of each type of habitat. This can be
done with the usage of climatic database, which is time series for each cell of
a regular latitude-longitude grid with sets of climatic parameters, which could
be available from the system Climate Wikience [9, 10] developed by DonNTU. This
becomes possible with a combination of established in this paper database of
Muridae, Sciuromorpha and Primates with the
database of the World Climate Center [11], which holds the archives of climate
data analysis and which are re-presented in Climate Wikience.
Archive
data from the World Climate Center allows you to build in time averaged field
of climatic parameters for the planet. Such averaging can be carried out for 15
years on latitude and longitude grid of the world with a cell of the 1x1
degree. The archive information is stored in a few terabytes with 80 climatic
parameters, such as temperature, relative humidity, wind speed and direction of
wind, light, rainfall, altitude, etc. With the use of regression analysis we
can identify the most important climatic parameters that affect the habitats
species distribution. As a result of a
species habitat GIS model can be put in correspondence with the attribute
information of the 80 averaged climate indicators. Besides from the database
can be taken attribute information quantitatively characterizing each type.
That is, the union of created database with the averaged World Climate Centre
database, that will help to create models of species distribution in the world.
It is assumed that future researches will be done in this area.
Summary. Therefore, the developed GIS model of species
distribution and created database with mapping and attribute data allow to
establish the rules of probability species distribution. The majority of the
information about the existing species of flora and fauna in the world will be
processed using the same technique, it would be possible to build a global
model of the planet's biodiversity for the life sustainability assess, similar
to the ideas of V.A. Kostitsyn.
References:
1.
Вымирание
биологических видов, потеря биоразнообразия и здоровье человека / http://base.
safework.ru/iloenc?doc&nd=857100187 &nh=0&ssect=0 (14.10.2012).
2.
Животные/Под
ред. Д. Бёрни, пер. с англ. – М.: Астрель, АСТ, 2008. – 624 с.
3.
Глобальные
изменения биологического разнообразия / http://bibliofond.ru/ view.aspx?id=
432952 (15.11.2012).
4.
http://www.ecolife.ru/e-lib/UR.pdf
(17.09.2012).
5.
Глобальный
доклад ООН о состоянии экосистем планеты (Millennium Ecosystem Assessment) / http://www.millenniumassessment. org/en/index.html
(10.10.2012).
6.
В.А.
Костицын. Эволюция атмосферы, биосферы и климата / Пер. с франц. Под ред. Н.Н.
Моисеева. – М.: Наука, 1984. – 96 с.
7. А.Г. Платонов, М.Я. Ахалая.
Применение метода пробит-анализа в радиобиологии. Расчет полулетальной дозы
ЛД50. Уч.-метод. пос. – М.: НИИЯУ МИФИ, 2010. – 36 с. / http://library.mephi.ru/Data-IRBIS/book-mephi/Platonov _Primenenie_metoda_probit-analiza_v_ radiobiologii_2010.pdf (09.09.2012).
8.
В.К.
Шитиков, Г.С. Розенберг. Оценка биоразнообразия: попытка формального обобщения / Jahrbuch fur EcoAnalytic
und EcoPatologic. 2004. – 39 с.
9.
Система Climate Wikience / http://wikience.donntu.edu. Ua (21.10.2012).
10. Rodriges Zalipynis R.A.,
Zapletin E.A., Averin G.V., The Wikience: Community Data Science. Concept and
Implementation., Proceedings of the 7th International Scientific-Technical
Conference "Informatics and Computer Technologies" (ICT-2011), Vol.
1, pp. 113 – 117, Donetsk, November 22 – 23, 2011.
11. Более 80 климатических показателей. / http://data-portal.ecmwf.int/data/d/ interim_full_moda/;
http://nomads.ncdc.noaa.gov/data.php?name =access#CFSR-data (20.10.2012).