Экология/6 экологический мониторинг
Cand.Sci. S.
Levitsky S.N 1, Nekrasovа D.О. 1, A. Levitskaya A.S. 2
1 North state medical University, Arkhangelsk,
2Gymnasium
№3, Arkhangelsk
Asymmetry of the sheet Betula pendula as air pollution indicator.
The system of ecological monitoring is
actual, because its aim is a study of the distribution of pollutants in time
and space, evaluation and forecast of the state of the objects of natural
environment.
Modern cities are the centres of the most
acute environmental problems, without solution of which is impossible society's
transition to sustainable development, providing the achievement of
socio-economic stability, preservation of a favorable environment and natural
resource potential. Arkhangelsk is a
large industrial city of Russia, where the environmental situation is
complicated. In the town of growth of diseases of the respiratory, circulatory,
nervous system, cancer. Sources of pollution are motor vehicles, power plants,
chemical production.
The
aim of the research was to identify
the anthropogenic load on the Betula pendula in the conditions of the
Arkhangelsk. Center for ecological policy of Russia and the Center for health
environment was developed and recommended to the application of the methodology
of estimating the amount of fluctuating asymmetry on the grounds of describing
the general morphological peculiarities of the sheet by
sounding sheet in plants with bilaterally symmetrical leaves [1-3]. This breed
is resistant to the gases, because the leaf has a thick cuticle, which is a noncell dense fatty
coating, fully covering the epidermis. Birch successfully
grown in cities with adverse ecological conditions, react to the state of the
environment.
Materials
and methods of research. The most
available and widely used morpho-genetic measure
of violation of stability of development - fluctuating asymmetry sheet as a
result of the inability of the organism to develop well-defined ways. Under
fluctuating asymmetry understand small undirected deviations from symmetry
condition [2, 4].
For the assessment of man-caused pollution
of the urban environment was used instrumental method, which is based on the
measurement of morphological parameters of the sheet. Applied the method based
on calculation of fluctuating asymmetry leaves with symmetrical form [2].
As the control have been selected stands
of Betula pendula, growing village Pochinovskaya in Ystianskiy district of the Arkhangelsk area. Collection of the materials
was made in the beginning of July (after the termination of growth of leaves).
Each sample consisted of 100 leaves (10 leaves of the tree), which had been
taken from the lower part of the crown of the tree with the maximum amount of
the available branches relatively evenly around the tree. Further analysis
produced by each plant. All were handled 3000 leaves. Selected middle-aged
trees 50-60 years, growing in similar ecological conditions.
To estimate the amount fluctuating
asymmetry of selected attributes describing General morphological features of
the sheet. From one sheet starred indicators on the 4-m parameters with the
left and right sides of the sheet. The value of asymmetry in every individual
is determined by the difference of the number of structures to the left and to
the right. Population assessment is expressed arithmetic average of the values
[5]. For plastic sign of the value of asymmetry is
calculated as the difference in measurements on the left and the right are
allocated to the measurement of us the two sides. The use of such relative magnitude
of need in order to neutralize the dependence of the asymmetry of the value of
the attribute.
The system of plastic signs of Betula
pendula, which was used to estimate the incidence of fluctuating asymmetry:
1) the Width of the half of the leaf.
2) the Length of the second from the base of the leaf
veins of the second order.
3) the Distance between the bases of the first-and
second-veins of the second order.
4) the Distance between the ends of these stem (Fig.
1).
Fig. 1. Indicators to determine the sheet
of Betula pendula.
For the morphometric measurements used
calipers. For each measured sheet are calculated relative values of the
asymmetry of each character. To do this, the difference between the dimensions
left (L) and right (R) divided by the sum of these
same measurement: (L-R)/(L+R) (Fig. 2). The fluctuating asymmetry evaluated by
an integral parameter values average relative differences between the parties
on a sign of the (arithmetic average of the relationship difference to the amount
of the sounding of the sheet on the left and on the right, which belongs to the
number of features). The higher the level of values of the indicator, the lower
the level of homeostasis development.
Range of values of an indicator of the
stability of the development expressed in conditional score (Table. 1).
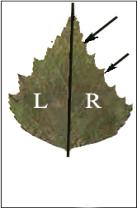
Fig. 2. Integral characteristics asymmetry sheet of
Betula pendula.
Table 1.
The scale of assessment of deviations of the state of
the organism from the conventional norms of the largest integral index of
stability of development for the Betula pendula (Zakharov et al., 2000).
|
The value of the feature |
Grade |
Characteristic |
|
До 0,040 |
1 |
The notional rate of. Usually observed in a sample
of plants of favorable conditions for germination. |
|
0,040-0,044 |
2 |
Minor deviations from the norm. Growing conditions
are unstable. |
|
0,045-0,049 |
3 |
Violation of vital activity of plants. |
|
0,050-0,054 |
4 |
Strong violation of life, plants suffer from
oppression. |
|
0,055 и выше |
5 |
A critical condition. The plants are in much
distress. |
The material for the study were collected
in 4 pilot sites.
1. Village Pochinovskaya, where the sources of anthropogenic impact are absent.
2. Voskresenskaya street (Arkhangelsk). Center of the
city, a large highway.
3. Troitsky Prospekt (Arkhangelsk). Center of the city
with a dense network of roads. 4. The embankment of the Northern Dvina river (Arkhangelsk).
Results and discussion.
Analysis
of the asymmetries of the leaves on the control site. The study of the asymmetry of the leaves of the Betula
pendula in the village Pochinovskaya
(ecologically clean region) was established, that she may be a control site.
Indicators of asymmetry on all 4-m parameters correspond to the 1 point,
respectively plants have not experienced the oppression of the processes of
life as a result of a gassed condition of the territory. The results of the
study in the control site are presented in table 2.
Table. 2.
|
Measure |
Coefficient of asymmetry |
Grade |
|
Plate width |
0,0192 |
1 |
|
The
length of the stem of the second order |
0,0300 |
1 |
|
The
distance between the veins of the first and the second order |
0,0240 |
1 |
|
The
distance between the ends of the veins of the first and the second order |
0,0260 |
1 |
|
The average value of the coefficient of asymmetry |
0,0371 |
1 |
A
generalized analysis of the asymmetries of leaves of Betula pendula in
different points of Arkhangelsk is presented in table 3.
Table. 3.
|
Measure |
Control site |
Troitsky
Prospekt |
Northern
Dvina Embankment |
Voskresenskaya Street |
|
Plate width |
0,0192 |
0,0540 |
0,0499 |
0,0460 |
|
The
length of the stem of the second order |
0,0300 |
0,0480 |
0,0420 |
0,0440 |
|
The
distance between the veins of the first and the second order |
0,0240 |
0,0400 |
0,0280 |
0,0320 |
|
The
distance between the ends of the veins of the first and the second order |
0,0260 |
0,0460 |
0,0400 |
0,0420 |
|
The average value of the coefficient of asymmetry |
0,0371 |
0,0470 |
0,0399 |
0,0410 |
|
Grade |
1 |
3 |
1 |
2 |
Analysis of the obtained results shows
that the value of the asymmetry of the feature depends on the location of the
survey sample in relation to the objects of pollution. On Troitsky Prospekt he
was the highest, that says about the affliction of the main indicators of vital
activity object of study.
A study of various morphological features
of the sheet showed that not all of the signs is equally responsive to the
pollution of the urban environment. The largest range of changes was observed
in the indicator width of the sheet.
Thus, in our study was not registered
areas belonging to the zone of extreme pollution that is often observed in the
publications of other researchers. In the indicators of the studied territory,
with the exception of the Troitsky Prospekt, are most likely to background
area, which testifies to the minor violations of homeostasis development and
the relatively favorable ecological environment.
Reference.
1.
Жукова М. Асимметрия
березового листа указала, где дети чаще болеют. - Природно-ресурсные ведомости.
2001, №48 (103).
2.
Захаров В.М. и др.
Здоровье среды: методика оценки. – М.: Центр экологической политики России,
2000. – 68 с.
3.
Егорова Е.И., Белолипецкая В.И. Биотестирование и биоиндикация
окружающей среды. - Обнинск, 2000.
4.
Кряжева Н.Г., Чистякова
Е.К., Захарова В.М. Анализ стабильности развития берёзы повислой в условиях
химического загрязнения. – Экология. 1996, №6, с. 441-444.
5.
Простейшие методы
статистической обработки результатов экологических исследований. - М., Экосистема,
1998.