Economic
sciences/2.International activity
Natalia M. Lashkevich
Master of Economics, PhD-candidate of the University
“G.d’Annunzio” Chieti-Pescara, Italy e-mail:
lashkevich.n@gmail.com, priorpost@mail.ru.
Assessment
of wheat import supplies and food risks
at the EU
single market
Summary
The article presents analyses
of cause relations between the EU’ wheat imports and identified food risks to
check a hypothesis and to assign the more “harmful supply” by month. The
following methods were used: statistical analysis, regression,
semi-quantitative assessment.
Keywords:
wheat, import, cultivate period,
regression, semi-quantitative assessment.
Introduction
The
analysis of world wheat import structure showed that the EU-27 takes the first
place in wheat imports during last five years. [1] Taking into consideration
that the import of harmful and danger grain will lead to the production
foodstuffs with food hazards, it is necessary to analysis cause relations
between wheat imports and food risks considered cultivate periods.
Statistical analysis
Spring
and winter wheat have different cultivate periods.[2], [3], [4]
Table 1 Cultivate periods for spring
and winter wheat
|
Cultivate stage |
Month |
|
|
Spring wheat |
Winter wheat |
|
|
Sowing |
May (the beginning). |
The end of August – the beginning of September. |
|
Growing |
June – July (generally). The vegetative phase is 75-110 days. |
September – June (generally). The vegetative phase is 240-320 days. |
|
Harvesting |
The beginning of July – the end of August or the
beginning of September. |
The beginning of July. |
|
Transport Handling |
After harvesting. |
After harvesting. |
|
Storage |
After handling – generally since September till
April/May next year. |
After handling – generally since July till August
next year. |
Source: [2], [3], [4]
So,
for the analysis tendencies at the Wheat Markets and directions of imports
flows of grains it is necessary to compare Cultivate Calendar for Wheat, food
risks and wheat imports into the EU market.
Table 2 Basic data
|
Month |
Cultivate period |
Food risks |
Wheat imports |
|||
|
Winter wheat |
Spring wheat |
QNT |
average |
millions tons |
average |
|
|
January |
Growing |
|
4 |
4 (incl. Dec) |
2,5 |
2,36 (incl. Dec) |
|
February |
Growing |
|
3 |
2,0 |
||
|
March |
Growing |
|
5 |
3 |
2,1 |
2,13 |
|
April |
Growing |
|
2 |
1,8 |
||
|
May |
Growing |
Sowing |
2 |
2,5 |
||
|
June |
Growing |
Growing |
0 |
0,33 |
2,0 |
2,16 |
|
Harvesting |
||||||
|
July |
Harvesting |
Growing |
0 |
2,3 |
||
|
Harvesting |
||||||
|
August |
Sowing |
Harvesting |
1 |
2,2 |
||
|
September |
Sowing |
Harvesting |
3 |
2,33 |
3,8 |
3,23 |
|
Growing |
||||||
|
October |
Growing |
|
4 |
3,2 |
||
|
November |
Growing |
|
0 |
2,7 |
||
|
December |
Growing |
|
5 |
|
2,6 |
|
Source: [5], [6]
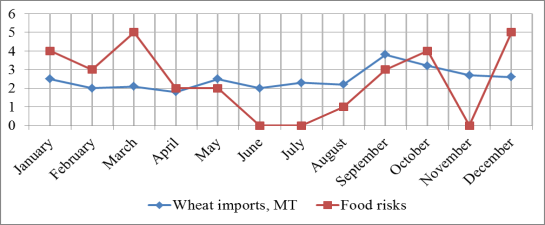
Figure
1. Dynamics of food risks and wheat imports, 2001-2011years
Figure
1 demonstrates fluctuations of food risks and wheat imports. The visual
analysis showed that during trade period spring-summer the volumes of imports
are at medium level. In autumn and
winter imports were increased (especially in September – November). The
analysis of food risks showed the fluctuation of food risks has the following tendencies: absence in June, July, November; the
increase since September; constantly notifications in a period “autumn – spring”;
the most quantity of notifications was received in winter.
Regression analysis
Taking
into consideration that the harvesting of spring and winter wheat begins in
June (as usually), so linear regression will built for calendar period:
summer-autumn-winter-spring. The
equation of linear regression is
y(x) = 1,727+0,046x, where (1)
xj - a single predictor variable – wheat imports
by month; y - a response variable –
food risks; α – a coefficient – 0,491;
β – a coefficient, a slope of
the regression line – 0,778.
The
coefficients of the linear regression demonstrate that the increase of wheat
imports in a month on 0,778MTs will lead to the growth of food risks on 0,491.
The correlation coefficient rxy
is 0,233. So, the linear regression (1) has a positive and weak linear
relationship (correlation) between variables. [7] The coefficient of
determination, denoted R2,
is 0,0545. The coefficient R2
converges to the zero and the linear regression (1) cannot be used for the
forecast. The value R2 =
0,0545 may be interpreted as follows: approximately 5,45% of the variation in
the response variable can be explained by the explanatory variable. The
remaining 94,55% can be explained by unknown, lurking variables or inherent
variability. [8] To assess the quality of the linear regression for the
forecast, the approximation error is calculated. The recommend level is 8-15%.
The calculated approximation error Ā
is 31.16%, so the linear regression (1) cannot be used for the forecast.
For
the testing null hypothesis the following coefficients were calculated: F-test and student’s t-test with probability α (0,05); k1
and k2 degrees of freedom
(1; 10 respectively). Taking into consideration that F-calculated < F-statistic (0,57<4,96), the linear regression
(1) is significantly at level α
(0,05) and t-calculated is below then
t-statistic (0,75<2,23) the null
hypothesis is rejected in favor of alternative hypothesis. [9], [10]
Semi-quantitative assessment
During
the analysis period – 2001-2011 years the following notifications about the
presence hazards in the wheat supplies were received: Mycotoxins, Insects, Pesticides residues, Heavy metals, Poor or
insufficient controls. Taking into
consideration, that in a month some notification were received, so it is
necessary to implement scaling assessment by weight number.
Table 3 Scalling system for hazards
|
Food
risks |
IARC
group |
Weight
number |
|
Mycotoxins |
1 |
0,3 |
|
Heavy
metals |
1 |
0,3 |
|
Pesticide
residues |
2B |
0,2 |
|
Biocontaminants |
3 |
0,15 |
|
Poor
or insufficient controls |
3 |
0,15 |
|
Total |
1,0 |
|
Table
3 shows that such carcinogenic food risks as” Mycotoxins”, “Heavy metals” and
“Pesticide residues” received the following IARC groups as 1, 1, 2B by the
principle: a carcinogenic food risk gets
number of the more harmful hazard into its categorical group. Among mentioned food risks groups the
following hazards were presented: Aflatoxins (IARC group – 1); Dichlorvos (IARC group – 2B); Nickel ore (IARC group – 1). For the
identification “harmful” group for non-carcinogenic food risks as
“Biocontminants” and “Poor or insufficient controls” used the principle: a carcinogenic food risk gets number of the
less harmful hazard into its categorical group. So, these food risks received a
IARC group 3, because such hazards as “Insects”, “Labelling” and
“Preservation” are non-carcinogenic.
The calculation results is presented in table 4.
Table 4 Calculation of weight coefficients
|
Month |
Food risks |
Mycotoxins |
Insects |
Pesticides residues |
Heavy metals |
Controls |
Weight coefficient |
|
Category |
0,3 |
0,15 |
0,2 |
0,3 |
0,15 |
Formula |
|
|
January |
Mycotoxins, Poor or insufficient controls |
3 |
|
|
|
1 |
3*0,3+1*0.15=1,05 |
|
February |
Mycotoxins |
3 |
|
|
|
|
3*0,3=0,9 |
|
March |
Mycotoxins |
5 |
|
|
|
|
5*0,3=1,5 |
|
April |
Mycotoxins,
Insects |
1 |
1 |
|
|
|
1*0,3+1*0,15=0,45 |
|
May |
Mycotoxins, Poor or insufficient controls |
1 |
|
|
|
1 |
1*0,3+1*0,15=0,45 |
|
June |
|
|
|
|
|
|
0 |
|
July |
|
|
|
|
|
|
0 |
|
August |
Mycotoxins |
1 |
|
|
|
|
1*0,3=0,3 |
|
September |
Mycotoxins |
3 |
|
|
|
|
3*0,3=0,9 |
|
October |
Mycotoxins,
Insects, Pesticides residues |
1 |
2 |
1 |
|
|
1*0,3+2*0,15+1*0,2
=0,8 |
|
November |
|
|
|
|
|
|
0 |
|
December |
Mycotoxins, Pesticides residues, Heavy metals |
3 |
|
1 |
1 |
|
3*0,3+1*0,2+1*0,3
=1,4 |
In according with table 4 the
interval of weight coefficients is between 0-1,5 thus for the semi-quantitative assessment of food risks and wheat
imports will apply the 6-score system presented in table 5. [11]
Table
5 Scoring systems
|
Score |
Category |
Import range, MTs |
Weight
coefficient |
|
6 |
Very
high |
3-4 |
1,3-1,5 |
|
5 |
High |
2-2,9 |
1,0-1,2 |
|
4 |
Medium |
1,1-1,9 |
0,7-0,9 |
|
3 |
Low |
0,6-1,0 |
0,4-0,6 |
|
2 |
Very
low |
0,1-0,5 |
0,1-0,3 |
|
1 |
None |
0 |
0 |
Summarizing scoring
systems for every month is presented in scheme 1.
|
Food risks |
Very
high |
|
|
|
|
March, December |
|
|
High |
|
|
|
|
January |
|
|
|
Medium |
|
|
|
|
February |
September, October |
|
|
Low |
|
|
|
April |
May |
|
|
|
Very
low |
|
|
|
|
August |
|
|
|
None
|
|
|
|
|
June, July, November |
|
|
|
|
|
None |
Very low |
Low |
Medium |
High |
Very high |
|
|
|
Wheat Imports |
|||||
Scheme 1 Severity level
of import period
Scheme 1 allowed to rank months by severity level: Very high - March, December; High -January, February, September, October; Medium -April, May,
August; Low - June, July, November.
Hence,
the strengthening border controls should be increased in period
autumn-winter-spring because during the storage the quantity of food risks is
increased (as usually) and admittance of harmful seeds will decrease the future
harvests and lead to the expansion of transferred food risks.
Conclusions
Spring and winter wheat has various
cultivated periods. The vegetative phase of spring wheat is 75-110 days and of
winter is 240-320 days. To analysis the possibility of relationship between
food risks and wheat imports by month of supplies the following analysis were
applied: statistical and regression analyses, semi-quantitative assessment.
The
built linear regression (1) has a positive and weak linear relationship
(correlation) between variables: the
increase of wheat imports in a month on 0,778 MTs will lead to the growth of
food risks on 0,491. However, this regression model cannot be used for the
modeling and forecasting because the coefficient of determination 0,0545,
thus the remaining 94,55% can be
explained by unknown, lurking variables or inherent variability.
Semi-quantitative assessment allowed to rank supplies by “more harmful”
month. So, it is necessary to strengthen the border control activity in period
“autumn-winter-the beginning of spring”.
References
[1] Grain: World
Markets and Trade. Trade Policy Review US DA, FG 10-10. WT/TPR/S/214/Rev.1 8
June 2009 (09-2701) // WORLD TRADE ORGANIZATION
[2] The wheat
growth guide, Spring 2008, second edition, 3-6 HGCA [e-source] http://www.goldsino.ru/field-of-activity
[3] Яровая пшеница. [e-source] http://www.fadr.msu.ru/rin/crops/summertriticum1.htm
[4] Озимая
пшеница. [e-source] [http://www.goldsino.ru/field-of-activity]
[5] Notifications
list [e-source] https://webgate.ec.europa.eu/rasffwindow/portal/
[6] International trade. Eurostat.
[e-source] http://epp.eurostat.ec.europa.eu/portal/page/portal/international_trade/data/database
[7] Aitken
Alexander Craig ‘Statistical Mathematics’ - 8th Edition. // Oliver & Boyd,
1957. ISBN
9780050013007
[8] Draper N.R.
and Smith H. ‘Applied Regression Analysis’ // Wiley-Interscience, 1998. ISBN
0-471-17082-8
[9] Triola Mario
‘Elementary statistics’ (8 ed.). Boston: Addison-Wesley, 2001. ISBN 0-201-61477-4.
[10] Lomax R. G..
‘Statistical Concepts’: A Second Course, 2007 ISBN
0-8058-5850-4
[11] Exposure
assessment of microbiological hazards in food. Guidelines: Microbiological risk
assessment series 7. // WHO/FAO, 2008