Stromov
G., Postgraduate
Student at Industrial and Medical Department, NI TPU, Tomsk
Ryzhkov
D., Postgraduate
Student at Industrial and Medical Department, NI TPU, Tomsk
Fokin
V., Doctor
of Sciences, Professor at Medical and Biological Cybernetics Department, SSMU,
Tomsk
Evtushenko
G., Doctor of
Sciences, Head of Industrial and Medical Department, Professor at NI TPU, Tomsk
Criteria for Optimal Regions
of Interest Retrieval on 3D Medical Images using Integral Assessment Method
The common approach for automated ROI retrieval in 3D
MRI images via Integral Assessment (IA) [2] Method was shown in [3]. Model MRIs
provided by BrainWeb [1] resources were used as source data. These MRI are
generated based on two phantoms: the normal one and with a pathology manifestation
(severe multiple sclerosis). Histograms of assessment distribution show that
segments contained the morphological substratum have greater values comparing
to ones without a manifestation. This could be used as a basis for ROI
retrieving in studied images. In this publication we will show a reconstruction
method of the morphological substratum and optimal criteria to do this
depending of noise level on data.
Source data are monochrome 8bit or 12bit 3D images
with 181×217 pixels in the traversal section and with an adjustable step
from 1 to 10 pixels on the axial direction (181 pixels as a limit). The lesions
are clearly observed in any scan mode, we have chosen T1-weighted images. In
this mode lesions are presented as hypointensive regions (refer to Figure 1).
Matrices for calculations are formed by the following way: source files are
split on small equal segments (flat or volumetric ones, or voxels) with equal
seeds from the beginning of coordinates for each one, and then these block are
unwrapping into a vector of normalized values of pixels' brightness. It is
important to note that a way of unwrapping doesn’t affect IA values, the
principal moment is in an uniformity of the unwrapping procedure for all the
images. Obtained by such way vectors are aggregated into 2d arrays presented
the referent or estimated state (depending on the phantom), respectively.
Series of calculations were performed for a certain
noise level (3%, 5%, 7%, 10%, 11%, 14% and 15%). A character of the IA
distribution was analyzed for each one. We've found out that there are a few areas
in sensitivity depending on the noise level:
· High sensitivity area: with level less or equal to 9% the morphological
substratum is detected in all slices and with any size of blocks;
· Conditional sensitivity area: ROIs are showed in results, but not in all
slices and/or not with all block sizes with noise level from 10% to 14%;
· “Blind” area: there are no ROIs in result starting from 15% of noise.
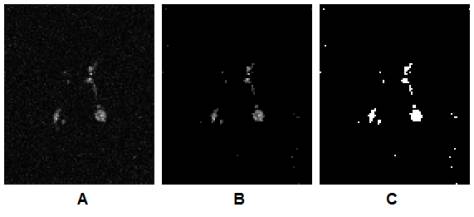
Optimality of partitioning size depends on the goal of
study. If we need to get a detailed description of ROI, it will be better to
chose small size of blocks. In this case the heterogeneity of studied region will
necessarily be shown as adjacent portions with high but different brightness on
the IA heatmap (Figure 2).
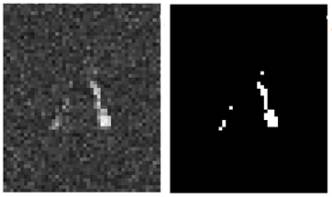
We can reduce the number of artifacts caused by noise
by increasing partitioning size and save an acceptable level of detail (Figure
3). The high level of noise makes it impossible to get detailed information
about ROIs, and using the “big” blocks is the sole way to detect a
manifestation of pathology (high level of noise is also could be treated as
small differences in the compared states).
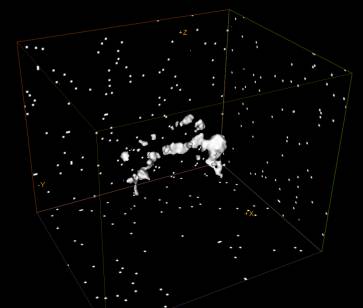
The study revealed correlations between noise level
and detailed elaboration of ROI in the result images. If there is information
about adjacency between detected ROIs we can build 3D reconstruction of a
morphological substratum (Figure 4).
References:
1. BrainWeb Simulated Database. URL: http://brainweb.bic.mni.mcgill.ca/brainweb/ (last accessed at 01/20/2014).
2. Fokin V.A. Tehnologija integral'noj ocenki
sostojanija biomedicinskih sistem // Sistemy upravlenija i informacionnye
tehnologii, 2008. – V(31). – P. 191-194.
3. Stromov G. G., Fokin V. A., Evtushenko G.S. Integral'naja ocenka
trehmernyh biomedicinskih izobrazhenij s ispol'zovaniem tehnologii
raspredelennyh vychislenij // Biotehnosfera, 2012. – V 3-4. – P. 68-72.
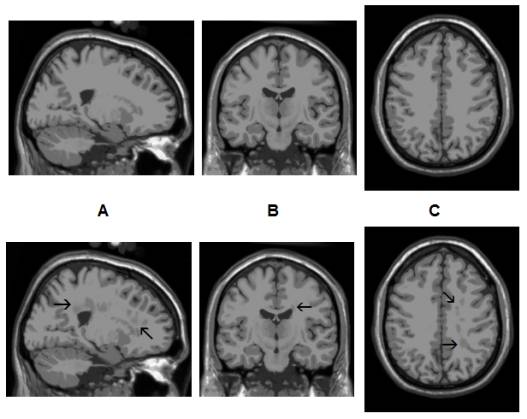
Figure 1. The normal (the top of the image) and pathological (the
bottom of the image) phantoms are shown in sagittal (A), transversal (B) and axial (C) sections. A
morphological substratum is pointed by arrows.
Figure
2.
Heatmap (A) of the IA distribution for blocks sized by 2×2×2 and 3% noise. (B) shows the same heatmap after 99%
of IA values were cut. In (C) these blocks were painted white for better
visibility.
Figure
3. ROIs are obtained for blocks sized 4×4×3
and 5% noise.
Figure
4. An isosurface reconstruction for a morphological
substratum obtained for blocks sized 2×2×2 and 3% noise.