Economic sciences
2. International activity
Master of Economics, PhD- Candidate Natalia
Lashkevich
University “G. d’Annunzio” Chieti-Pescara, Italy.
Dilemma of the Single Cereal Market
Summary
The one of perspective measures of the Europe 2020 strategy in 2010 is
"A Single Market for 21st century Europe". The analysis of the WTO
report showed the single market is not yet a reality in all areas. To achieve
the EU 2020 strategy objectives it is necessary to relaunch Single Cereal
Market in order to create new opportunities for the EU business operators without
imposing new restrictions. However, increasing of the global trade in food
contributes to food risks. That is why the Dilemma of the Single Market is to increase
the international trade of food, develop the European business support and to
reduce the level of food hazards and ensure the safety consumption for
consumers.
Keywords
Market, cereal,
cereal products, strategy, dilemma, Trade, food hazards,
risks, food safety
Introduction
The trade and commercial policies occupy an
essential place in international activity of the EU. In according with the Article 131 in the Treaty, the EC common
policy aims to "contribute, in the common interest, to the harmonious
development of world trade, the progressive abolition of restrictions on
international trade". This objective is in line with the general aims of
the Treaty "to promote, throughout the Community, a harmonious, balanced
and sustainable development of economic activities, …, a high degree of competitiveness
and convergence of economic performance, …, and economic and social cohesion
and solidarity among Members". [1,p13] However, the creation of the single
successful Europe is a long-term process.
The main steps of the European economy policy are the following:
- The Lisbon European
Council of 23 and 24 March 2000 set the objective of making the European Union
the most competitive and dynamic knowledge-based economy in the world[2]
- the Göteborg
European Council of 15 and 16 June 2001 agreed the Union's Strategy for
Sustainable Development to ensure that economic growth, social inclusion and
environmental protection. [3,p.3], [4]
- the Johannesburg
World Summit on Sustainable Development in 2002 [3,p3]
- Elaboration the
Policy of open markets as a part of the Lisbon Strategy in 2006 [5];
- Adoption of the
European Economic recovery plan in 2008 [5];
- Elaboration of the
Europe 2020 strategy in 2010 where the one of perspective measures is "A Single
Market for 21st century Europe" [6], [7], [8,p.13].
Cereal Market:
trade and food safety aspects
The analysis of the WTO report showed the single market is not yet a
reality in all areas. On agricultural goods, the EC offer has been, since
October 2005, to increase market access and decrease domestic support, and to eliminate
all trade-distorting export practices by 2013 and also called for an enhanced
extension of the possibilities to protect agricultural products with a view to
improving the possibilities for consumers to choose quality products.
Table 1 World coarse grain
trade.
|
Parameter |
2006/07 |
2007/08 |
2008/09 |
2009/10 |
|
1 |
2 |
3 |
4 |
5 |
|
World total, thousand metric tons |
114.714 |
128.839 |
110.658 |
117.550 |
|
Production, thousand metric tons |
987.268 |
1.079.986 |
1.109.679 |
1.105.756 |
|
Domestic consumption, thousand metric tons |
1.012.320 |
1.056.949 |
1.079.053 |
1.101.357 |
|
Ending stock, thousand metric tons |
140.704 |
163.741 |
194.367 |
198.766 |
Source
of Data: [9]
The
table 1 shows the world grain market is characterised of sustainable
development during 2006-2010 years. The production usually covers domestic
consumption in grain.
Table 2 The EU-27 coarse grain trade
|
Parameter |
2006/07 |
2007/08 |
2008/09 |
2009/10 |
|
1 |
2 |
3 |
4 |
5 |
|
TY Export, thousand metric tons |
5.463 |
4.679 |
4.338 |
4.230 |
|
TY Import, thousand metric tons |
8.738 |
19.892 |
2.996 |
3.090 |
|
Production, thousand metric tons |
137.421 |
136.123 |
161.486 |
152.960 |
|
Domestic consumption, thousand metric tons |
147.877 |
154.155 |
151.305 |
150.180 |
|
Ending stock, thousand metric tons |
15.138 |
12.768 |
20.809 |
23.796 |
Source of Data: [9]
Notes: TY – trade year
The
graphic of the EU grain market will allow to determine trends on this market.
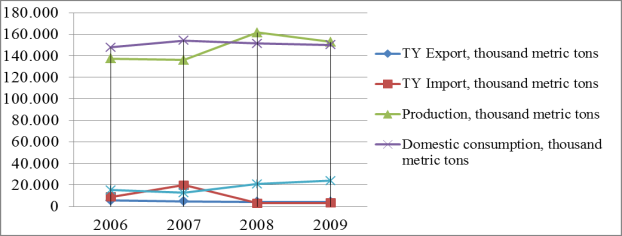
Figure 1. Dynamic of the EU-27 grain trade, 2006-2009 trade years
In 2007
the production of grain in the EU was at the same level as in 2006 and
consisted 136.123 thousand metric tons. The growth of the grain consumption on 6.278 thousand metric tons (154.155-147.877) increased the import on 11.154 (19.892-8.738) thousand metric tons.
In 2008
the growth of the production (on 25.363) and the decline of grain
consumption (on 2.850) thousand metric tons led to the
decrease of the import on 16.896 (2.996-19.892) thousand metric
tons.
In 2009
trade year the grain market was characterised the more sustainable condition in
the compares with the 2006-2008 trade years: despite on decline of the production
on 8.526, its level (152.960 thousand
metric tons) covered the domestic consumption (150.180 thousand
metric tons). As a result the level of grain import in 2009 was (3.090) the
same as in 2008 trade year.
The
analysis of the EU grain market allowed to establish the following index correlations:
- the excess
of the consumption over the production contributes to increased imports;
- the
growth of production and the decline of consumption способствуют decrease of
import.
That is
why, to achieve the sustainable development of the EU grain market in the
perspective period it is necessary to development strategical science researches
in the agriculture area in order to find new possibilities of production
growth. With this view it is necessary to analyse the
EU agricultural resources.
Table 3 Organic
farming data
|
Time |
Total crop area, Ha |
Share of total organic crop area out of total
Utilised Agricultural Area,% |
||||
|
The EU-15 |
The EU-27 |
Deviation (+,-) |
The EU-15 |
The EU-27 |
Deviation (+,-) |
|
|
1 |
2 |
3 |
4 |
5 |
6 |
7 |
|
2006 |
5.733.240 |
6.881.674 |
1.148.434 |
4,4 |
3,7 |
-0,7 |
|
2007 |
5.933.271 |
7.265.902 |
1.332.631 |
4,6 |
4,0 |
-0,6 |
|
2008 |
6.327.320 |
7.785.291 |
1.457.971 |
5,0 |
4,4 |
-0,6 |
|
2009 |
6.966.403 |
8.600.911 |
1.634.508 |
5,3 |
4,7 |
-0,6 |
Source: [10]
The
table 3 shows the integration of countries and implementation of elaborated
CAP allow to increase the crop area
every agriculture year. So, the growth of crop is the one of factors influenced
on the growth of grain production (see table2). However, the share of total
organic crop area in the EU-27 has declined in comparison with the EU-15. Thus, the effective agriculture practice and
support of organic farming are the main strategic developments.
Integration
processes are characterised by the following aspects: “The global trade in food
is increasing in every year, contributing to the risk of spread of pathogens
and contaminants across national borders.” [11] So, in frameworks of the
expansion food markets the European and world community forced with challenges to ensure food safety.
The
analysis of data from RASFF report 2009 showed that during period 2004-2009 the
quantity of notifications is constantly increased (see the table below).
Table 4. The information flows of the RASFF (Rapid Alert System for Food and Feed)
|
Time |
Alert |
Information |
Border rejection |
News |
Follow-up to alert |
Follow-up to information |
Follow-up to border rejection |
Follow-up to news |
Total |
|
1 |
2 |
3 |
4 |
5 |
6 |
7 |
8 |
9 |
10 |
|
2004 |
690 |
553 |
1338 |
89 |
1449 |
504 |
825 |
0 |
5448 |
|
2005 |
955 |
747 |
1453 |
86 |
2218 |
679 |
842 |
0 |
6894 |
|
2006 |
910 |
678 |
1274 |
72 |
2157 |
640 |
923 |
0 |
6591 |
|
2007 |
952 |
761 |
1211 |
43 |
2440 |
796 |
978 |
0 |
7181 |
|
2008 |
528 |
1138 |
1377 |
47 |
1789 |
1329 |
743 |
76 |
7027 |
|
2009 |
557 |
1191 |
1456 |
42 |
1775 |
1861 |
871 |
87 |
7840 |
|
% |
+5.5 |
+4.7 |
+5.7 |
-10.6 |
-0.8 |
+40 |
+17.2 |
+14.5 |
+11.6 |
Source
of Data: [12,p.56]
The table 4 reflects market notifications inserted in the RASFF. The notifying country reports to RASFF about
risks which the country has identified. And also send information about
risk-product, traceability and safety measures it has taken.
In order to implement a successful controlling, all
market notifications are classified as: ‘alert
notification’ or ‘alert’, ‘information
notification’, ‘border rejection notification’, ‘news
notification’. The all market notifications are identified
as: an ‘original notification’ or as a ‘follow-up notification’.
In accord with table data, the total level of
information flows about food risks is very high - about 7000 a year (column 10).
It is necessary to admit the level of notifications about serious risks
(“alert”) in 2009 in compares with 2004 is reduced (690 and 557 accordingly – column
2). But the level of border refusals is fairly high and amounts to about 1300
notifications a year (column 4). The data of the table show a high level of
information notifications in 2008 and 2009 years (1138 and 1191 accordingly – column
3). These notifications point at the increasing attention of countries to the
national control quality systems.
The Single Grain (Cereal) Market covers trade of
grain, cereal and cereal products.
Table 5 Market of
cereal products of the EU-27 in 2006-2009.
|
Parameter |
2006 |
2007 |
2008 |
2009 |
Average
data |
|
Bakers’ wares |
|||||
|
Export, kg |
69110.900 |
83.004.700 |
79.712.900 |
80.850.900 |
78.169.850 |
|
Import, kg |
75.547.200 |
82.637.200 |
78.254.700 |
78.801.100 |
78.810.050 |
|
Production, kg |
1.307.478.436 |
1.400.000.000 |
1.400.000.000 |
1.400.000.000 |
1.376.869.609 |
|
Pasta and pasta products |
|||||
|
Export, kg |
24.552.900 |
27.425.200 |
27.297.900 |
29.219.300 |
27.123.825 |
|
Import, kg |
95.184.300 |
113.712.000 |
119.242.600 |
125.330.800 |
113.367.425 |
|
Production, kg |
917.000.000 |
1.052.472.480 |
772.606.459 |
706.200.000 |
862.069.735 |
|
Fresh bread |
|||||
|
Export, kg |
51.427.200 |
57.021.000 |
62.972.800 |
64.154.400 |
58.893.850 |
|
Import, kg |
4.144.300 |
7.148.300 |
8.721.700 |
5.526.000 |
6.385.075 |
|
Production, kg |
16.027.181.038 |
16.888.424.055 |
20.082.938.064 |
20.224.012.800 |
18.305.638.989 |
Source of Data: [13]
The analysis of table 5 showed that among export
cereal products “Bakers’ wares” and “Fresh bread” have the largest shares (78
and 59 thousand tons accordingly). “Pasta and pasta products” are the main
import products for the EU. Its share in the import is about 113 thousand tons.
In accordance with the table, the import of
“Pasta and pasta products” has sustainable tendency to the growth.
Taking into consideration matters of food safety,
it is necessary to analyse food risks on trade at the Single Cereal Market.
Table 6. Dynamic of notifications.
|
Parameters |
2008 |
2009 |
Deviation
(+,-) |
Growth
rate, % |
|
1 |
2 |
3 |
4 |
5 |
|
Total
notifications
of cereal and bakery products |
161 |
212 |
+51 |
131,7 |
|
Alert
notifications
of cereal and bakery products |
40 |
46 |
+6 |
115 |
|
Information
notifications
of cereal and bakery products |
58 |
129 |
+71 |
222,4 |
|
Border
rejection notifications of cereal and bakery products |
63 |
37 |
-26 |
58,7 |
|
Total
notifications of all products |
3045 |
3204 |
-159 |
105,2 |
Source of Data: [12,p.64]
In
accordance with the table 6 the subtotal of notification decreased in 2009 on
159. The positive tendency is the decline of “Border rejection” notifications
of cereal and bakery products. However, the quantity of “total” and
“information” notifications increased on 31,7% (131,7-100) and 122,4%
(222,4-100).
Table 7. Notifications
by hazard category and product category in cereals and bakery products, 2009
|
Hazard category |
Quantity |
Share, % |
|
1 |
2 |
3 |
|
GMO/novel food |
49 |
29.2 |
|
Allergens |
24 |
14.2 |
|
Micotoxins |
21 |
12.5 |
|
Composition |
20 |
12 |
|
Foreign bodies |
18 |
10.6 |
|
Food additives |
10 |
6 |
|
Microbiological contaminants |
6 |
3.6 |
|
Industrial contaminants |
6 |
3.6 |
|
Pathogenic micro-organism
(potentially) |
3 |
1.7 |
|
Pesticide residues |
2 |
1.2 |
|
Heavy metals |
2 |
1.2 |
|
Not determined/other |
2 |
1.2 |
|
Organic aspects |
2 |
1.2 |
|
Bad or insufficient controls |
2 |
1.2 |
|
Biocontaminants |
1 |
0.6 |
|
Total |
168 |
100 |
Source of Data:
[12,p.61]
Table 7 shows the data of food safety of cereals and bakery products. The main hazard categories are GMO/novel food/, allergens,
micotoxins, composition, foreign bodies, food additives. In order to prevent
these food risks of cereal and cereal products it is necessary to improve the
control and monitoring along the food chain, namely such links as farming (cultivation
and processing), storage and producing.
Dilemma of the Single Market: perspective
approach.
The
analysis of the world grain market and the European cereal market showed that
the Dilemma of the Single Market is to develop the European business support
and to reduce the level of food hazards and ensure safety consumption for
consumers.
In
order to achieve the EU 2020 strategy,
the
perspective measure is the relaunch of the single market. [14] The relaunch of the Single Cereal Market must
open up new opportunities without imposing new restrictions, secure the better market access for the EU
business and upgrade the strategic dialogues with key third countries in order to create well-functioning and well-connected
markets with fair competitiveness for business operators.
In the
area of food safety the main strategic challenges are the prevention of food
risks and introduction of “a global strategic for the surveillance of foodborne
diseases and for the efficient gathering”. [11] The ensuring of food safety
should consider the following initiatives as:
- Global implementation
of harmonized food standards.
- The further
development of systems for surveillance for foodborne disease and food
contamination, product tracing and recall and strengthened laboratory capacity.
- The increasing of actions
on food safety at the national and international levels across the full length
of the food chain from farm to consumption.
- The timely conduct
of international risk assessments through a systems approach in order to tackle
more efficiently and consistently food-safety issues.
Conclusions
During
the past two decades, the creation of the single market and the opening of
borders have been two of the main driving forces behind growth in Europe. However,
the increasing of the international trade in grain, cereal and cereal products leads to the growth
of food risks and hazards. To solve the Dilemma of the Single Cereal Market, it
is necessary to achieve closer collaboration between the health-epidemical and economic
sectors in order to ensure the global management of food safety based on
science principles and system approach and taking in account that protection of
food safety cannot lead to discrimination or restriction on international
trade.
References:
[1] Trade Policy
Review WT/TPR/S/214/Rev.1 8 June 2009 (09-2701) // WORLD TRADE ORGANIZATION
[2] Decision No
1639/2006/EC of the European Parliament and of the Council of 24 October 2006
establishing a Competitiveness and Innovation Framework Programme (2007 to
2013) ‘©European Union,
http://eur-lex.europa.eu/’
[3] Communication
from the Commission to the European Parliament, the Council, the Economic and
Social Committee and the Committee of the Regions - Towards a global
partnership for sustainable development /* COM/2002/0082 final */‘© European
Union, http://eur-lex.europa.eu/’
[4] PRESIDENCY
CONCLUSIONS GOTEBORG EUROPEAN COUNCIL 15 AND 16 JUNE 2001 00/1/01 REV 1 1
[5] Communication from
the Commission to the European Parliament, the Council, the European Economic
and Social Committee and the Committee of the Regions - Mainstreaming
sustainable development into EU policies : 2009 Review of the European Union
Strategy for Sustainable Development /* COM/2009/0400 final */‘© European
Union, http://eur-lex.europa.eu/’
[6] Commission working
document - Consultation on the future "EU 2020" strategy
/*COM/2009/0647 final */‘© European Union, http://eur-lex.europa.eu/’
[7] COMMUNICATION
FROM THE COMMISSION TO THE EUROPEAN PARLIAMENT, THE COUNCIL, THE EUROPEAN
ECONOMIC AND SOCIAL COMMITTEE AND THE COMMITTEE OF THE REGIONS Annual Growth
Survey: advancing the EU's comprehensive response to the crisis /* COM(2011) 11
final*/‘© European Union, http://eur-lex.europa.eu/’
[8] COMMUNICATION
FROM THE COMMISSION EUROPE 2020 A strategy for smart, sustainable and inclusive
growth / *COM(2010) 2020*/‘© European Union, http://eur-lex.europa.eu/’
[9] Grain: World
Markets and Trade// Circular Series FG 10-10 October 2010// USDA, Foreign
Agricultural Service.
[10] Eurostat – Data Explorer “Certified
organic crop area” [food_in_porg1] http://appsso.eurostat.ec.europa.eu/nui
[11] Advancing food
safety initiatives // the Sixty-third World Health Assembly, Having considered
the report on food safety – A63/11 (A63/VR/7), 2010
[12] The Rapid Alert System
for Food and Feed (RASFF) Annual Report 2009 / The Health and Consumer
Directorate-General of the European Commission manages the RASFF, - Luxembourg:
Publication Office of the European Union, 2010.
[13] Eurostat – Data Explorer “PRODCOM
ANNUAL SOLD (NACE Rev.2.)” [DS-066341] http://appsso.eurostat.ec.europa.eu/nui
[14] COMMUNICATION
FROM THE COMMISSION TO THE EUROPEAN PARLIAMENT, THE COUNCIL, THE ECONOMIC AND
SOCIAL COMMITTEE AND THE COMMITTEE OF THE REGIONS Towards a Single Market Act
For a highly competitive social market economy 50 proposals for improving our
work, business and exchanges with one another /* COM/2010/0608 f/2 */‘©
European Union, http://eur-lex.europa.eu/’