Хімія
та хімічні технології/ 6. Органічна хімія
Panasenko O. I., Buryak V. P., Samura T. O., Panasenko
T. V., Gotsulya A. S., Timoshik U. V., Guzhva A. A., Vovnjanko O. I.
The investigation of
UV-spectra of some thiazoles and benzothiazoles
Zaporozhye state Medical
University
National University of the
life and environmental sciences of Ukraine
Abstract. The UV-spectra of
thiazoline-2-thione, 3-N-methyl-benzthiazoline-2-thione and 2-methyl-thiobenzthiazole
in range of 2-thione, 3-N-methylbenzthiazoline-2-thione and
2-methyl-thiobenzthiazole in a range of solvent have been determined, solvent
effects noted and assignments given for the main absorption bands. The spectra
of thiazoline-2-thione and thiazolidine-2-thione are interpreted by their
relationship to the spectra of dithiocarbamates, the intense long-wavelength
UV-absorption band in the spectra being assigned to an intramolecular
charge-transfer transition involving the thioamide grouping. The UV-spectra of
benzthiazoline-2-thione and 3-N-methylbenzthiazoline-2-thione are related to
the spectra of benzthiazole and thioamides. The very intense long-wavelength
band in the spectra of these compounds is also assigned to an intra-molecular
charge-transfer transition involving the thioamide grouping.
The most
extensive study of the ultra-violet spectra of thioamides is that of Brand and
Eglinton which has been reported in a thesis [5] and a series of papers [3, 8, 9]
published within the last few years. However, there has been little systematic
study of the spectra of heterocyclic thioamides despite the many papers which
have reported the spectrum of benzthiazoline-2-thione (I) which is an
industrially important accelerator for the vulcanization of unsaturated elastomers
[2]. Although (I) is often referred to as 2-mercaptobenzthiazole (II), the very
close similarity of the intense long-wavelength UV absorption band with that of
the N-Me derivative (III), and its dissimilarity from that of the S-Me
derivative (IV), has been taken as evidence in favor of structure (I).
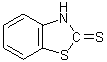
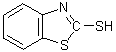
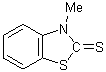
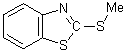
I II III IV
More
direct evidence that 2-mercapto-benzthiazole has structure (I) is that in
dilute solution in carbon tetrachloride there is a free-NM band at 340 nm. Also
[1] report that in the crystalline state compound (II) molecules exist in the
thione form, and are arranged in hydrogen bonded helical chains. Browning in
1986 attempted a partial description of the origins of the absorption bands of
benzthiazoline-2-thione and painted out the difficulty of giving a full
interpretation due to the unavailability of the spectra of reference compounds.
Recently,
in article was reported a study of thiazole (V), and benzothiazole (VI), and
given assignments which show the derivation of the spectra of these compounds
from thiophen and benzo-[β]-thiophen respectively. In the present work
author describe the spectra and where possible give assignments for
thiazolidine-2-thione (VII), thiazone (I), 3-N-methylbenzthiazoline-2-thione
(II) and 2-methyl-thiobenzthiazole (IV):
![]()

![]()
![]()
V VI VII VIII
The
thione compounds (I), (VII), and bands [4] in the solid state and solution. The
stability at room temperature of the hydrogen bonded species in solution
decreases in the order (VIII), (I), (VII) [4]. The spectra were measured with a
«Specord 200-222U214» spectrophotometer using matched 10 mm and variable path
length silica cell. Errors in measurements of absorption coefficients are less
than 5 per cent wave numbers are given to ± 4 nm, but because of the broadness
of some of the maxima it was felt that the assignment of one frequency value
was unjustified and accordingly limits between which the maximum lies have been
quoted. Limits have also quoted for shoulders and inflections.
The
ultra-violet spectra of thiazoline-2-thione in solution in n-hexane there are
two intense bands at 202 and 312 nm respectively. Between these bands there are
two shoulders at 222-227 nm and 244-253 nm, of much lower intensity. On the
long wavelength side of band there is a shoulder at 323-328 nm. The spectra in
water and other hydroxylic solvent closely resemble those in the hydrocarbon
solvents, apart from the disappearance of the shoulder in the region 222-227 nm
and that on this band and a red shift of band (323-328 nm) in methanol and
ethanol. In 2M hydrochloric acid the position of band 323-328 nm and shoulder
244-253 nm negligibly different from those in water. In dilute sodium hydroxide
only one band, at 294-295 nm, is resolved. The spectrum in concentrate sulfuric
acid has a band at 293 nm, a broad shoulder extending from 204-215 nm, and a peak
at 192-194 nm. The ultra-violet spectra of thiazolidine-2-thione in solution in
n-hexane there are two intense bands 278-279 nm and 202 nm respectively. Between
these bands are a shoulder at 217-224 nm and a subsidiary maximum at 247 nm.
The spectrum for a solution in methanol shows a blue-shift in band to 275 nm
and a merging of the subsidiary maximum 254 nm with band 275 nm to give a
prominent shoulder at 250-254 nm. In ethanol band 275 nm and shoulder 254-256
nm are in the same position as in methanol. In water band 270 nm shows a
further blue shift, and band 207-211 nm is broadened with a red shift. In
dilute aqueous hydrochloric acid, band 270 nm is broader than in water and is
asymmetric on the short-wave length side although no inflection can be resolved
near 245 nm. In aqueous sodium hydroxide there is one broad band at 241 nm. The
spectrum in concentrate sulfuric acid is quite different from those in the
other solvents and consists of the broad band with a main maximum at 240 nm and
a subsidiary maximum at 263-265 nm. In the spectra in benzene and ethanol there
is a low intensity maximum (Emax.=100), band 352 nm and 330 nm
respectively. This band was not observable in the hydrocarbon solvents and
water.
The
UV-spectra of solutions of benzthiazoline-2-thione
and 3-N-methyl-benzthiazoline-2-thione have three main bands A, B and C of
closely comparable extinction coefficients, which occupy the wavenumber regions
196-204 nm, 222-224 nm and 323-333 nm respectively. Including subsidiary maxima
and inflections there ore ten spectral features, not all of which ore
observable in every solvent. Band has a maximum occurring in the region 323-333
nm, and in hydrocarbon solvents also has two shoulders on either side of the
maximum. The series of four inflections lying between 250 and 299 nm are not
observable in n-hexane solution whereas in aqueous solution, they are clearly
visible, being resolved as a small peak. Band B consists of peak with a maximum
lying between 229 and 235 nm with shoulder on the lower frequency side. For the
spectrum of 3-N-methyl-benzthiazoline-2-thione is resolved as a peak in
hydrocarbon and methanol solution, whereas for the spectrum of
benzthiazoline-2-thione in the same solvents is a broad shoulder. Shoulder at
247 nm is not resolved for either compound in water or aqueous hydrochloric
acid. Band C consists of the single peak which occurs at 197 nm for each
compound in n-hexane and 204-205 nm in water. The extinction coefficients of
bands A, B, C in water are respectively 24700, 14000 and 20200 for
benzthiazoline-2-thoine and 23500, 13850 and 15350 for 3-N-methyl-benzthiazoline-2-thione.
The spectrum of 3-N-methyl-benzthiazoline-2-thione is solution in dilute alkali
resembles very closely the spectrum in water and dilute hydrochloric acid,
whereas the spectrum of ionized benzthiazoline-2-thione in dilute alkali is
different from that in water, in that band a has a maximum at 312 nm and an
extinction coefficient of 20500. The spectra of these two compounds protonated
in concentrate sulfuric acid are very similar but differ considerably from the
unionized species. The UV-spectrum of solutions of 2-methyl-thiobenzthiazole
has three main bands D, E, F which occupy the regions 198-200 nm, 223-228 nm
and 278-302 nm respectively. The extinction coefficient of E and F are almost
identical whereas that of D is about 60 percent lower. Including subsidiary
maxima and inflections, there are seven spectral features. Band D has the main
maximum at 278-280 nm and two subsidiary maxima in the region 288-291 nm and
299-302 nm respectively. The two features are observable in both hydrocarbon
and aqueous solutions. Band E consists of peak which occurs in the region
198-200 nm. The extinction coefficients for bands D, E and F in water are
respectively 13100, 18800 and 18600. The spectrum in dilute aqueous alkali is
essentially the same as that in water. In dilute hydrochloric acid the spectrum
is altered considerably.
The
extinction coefficient of band D is increased to 17750 and subsidiary maxima
disappear leaving a brood maximum at 307-308 nm. The extinction coefficient of
band E is diminished to 10600 leaving the peak and shoulder in the 238-256 nm
region appearing more prominent. Band F was not completely observable because
of solvent out-off. The spectrum in concentrate sulfuric acid closely resembles
that in 2M hydrochloric acid. Solute-solvent hydrogen bonding and not to
differences in dielectric constant and refractive index of the solvents since there
is a very wide range.
Results. UV-spectra of thiazoline-2-thione
and thiazolidine-2-thione have four and five main spectral features
respectively. There systems are similar to the thioamides except that the -NH-C=S
system forms part of the thiazoline ring. The UV-spectra of both
thiazoline-2-thione and the saturated thiazolidine-2-thione are readily
interpreted in terms of the four bands, that in to be present in nearly all
thioamides. The positions of these bands and their relationship to the four
main bands characteristic of thioamides are show in our investigation by
reference to the ultra-violet spectra of the methyldithiocarbamates.
References
1.
Bauman R. P. Absorption spectroscopy / R. P. Bauman // New York, USA, 1997. – 287
p.
2.
Blandamer M. J. Theory and applications of charge transfer-to-Solvent Spectra /
M. J. Blandamer, M. F. Fox // Chem. Rev., 1990. - Vol. 90, №59. – P. 78.
3. Braude E. A.
Determination of organic structures by physical methods / E. A. Braude, F. C. Nachod
// New York, USA, 2005. – P. 131 – 193.
4.
Braude E. A. Progress in stereochemistry / E. A. Braude, E. S. Waight, W. Klyne
// London, UK, 1994. – 549 p.
5.
Braude E. A. Ultraviolet absorption and structure of organic compounds / E. A.
Braude. - Ann. Repots. Chem. Soc., 1997. – Vol. 42, №105 – P. 34 – 41.