Economics
/6.Marketing and Management
Ph.D. in Economics F.I.Bokizhanova,
Ph.D. in Economics E.B.Romanko
Buketov Karaganda State University, Kazakhstan
Methodology of the project management.
We may
say for sure that today project management methodology (PM) has proven its
right to be one of the most highly effective methods of successful projects. In
many countries around the world view of project planning, the general concept
of determining the content and boundaries of the project, scheduling, cost control,
tracking the progress of the project have become part of everyday life of
managers working in various application areas. However, the market is not
static, and the increasing competition is forcing companies to seek new and
more effective ways to improve the success of ongoing projects and the quality
of products and services. Increasingly, the attention of project managers and
their managers drawn to methods of allowing not only to successfully plan and
implement the project within the available budget and schedule, but skillfully
avoid all the "reefs", seemingly stemming from uncontrollable
factors. So, the article is dedicated to the project management section, called
"risk management". Risk Management (RM) - is a set of knowledge and
skills which allows planning and implementing actions to respond to negative or
positive developments that have a certain degree of probability of occurring
during the project in case of budget implementation and project schedule.
Worldwide,
RM exists as a separate discipline - just like many other disciplines, united
in a common project management methodology. Thus, all components of the PM
methodology are not the know-how. Furthermore, we undertake to say that the
novelty of this methodology is to integrate a variety of methods and fields of
knowledge, eventually describing all aspects of a managed project. That it is
the basis of a project management "miracle", which allows to be
called as the most successful methodology for projects implementation. Therefore,
risk management will be considered in connection with other major parts of
project management. It should be said that in one article, we certainly will
not be able to touch all parts of the PM methodology, which may be considered
in relation to risk management. To create a complete picture we would have to
rebuild the project management knowledge. Therefore, we will focus on several
examples that, in our opinion, illustrate all said above very well. Based on
the definition of project management, Project Risk Management consists of four
main components: risk identification, risk assessment, risk develop responses
and risk control. Risk identification is- a process carried out in the first
place and then accompanies the management of the project until its completion.
Various methods of group work (brainstorming, nominal group and Delphi), as
well as an analysis of similar projects in similar areas with the participation
of external or internal company experts are recommended to be used its
implement and other manuals on project management. But the logic of the
integrated project management teaches us that to determine the risk we have to
use mechanisms that are relevant to other PM areas. One such mechanism is the
project work breakdown structure or WBS. Formally, it refers to the management
of content and scope of the project, but in fact widely used in almost all
other areas of PM knowledge and has become a PM methodology "visit card
". Indeed, what other logical ways we can determine as accurately as all
possible project work related to the manifestation of certain risk events? It
is known that at the stage of project planning completion all the project work
defined by WBS, should describe the project content and its scope to 95%. This
gives us a chance to determine all the potential "points of risk
manifestation” with a high degree of probability. However, WBS – is not just
the diagram shown on a paper. It is a virtual map of meetings with the
participation of project stakeholders, with these or other expertise skills on
the project content and its boundaries.
Thus
while WBS discussing and developing, we can successfully get a large amount of
expert confirmed information regarding project risks. Finally, the WBS logical
structure gives us the ability of organized and progressive review of all
project components on the potential risks’ subject. Risk and project budget:
the cost of risk and risk management cost in management project, we are faced
with the risk analysis of the project budget at the very first stage. Indeed,
in the drafting project plan process including the priority of operations at
the end of its work is initiated in the process of developing detailed project
budget, which is formed due to the valuation of WBS work. Moreover, if we are
aimed to maximize the quality and accuracy of our estimates, we should
undertake a statistical analysis according to a method similar to the analysis
of the project duration. Let’s put in remembrance that when we use this analysis,
we calculate the end date of the project in accordance with the dates of its
work completion as a kind of gap values corresponding to the average length of
± 2 standard deviations. According to statistics, the actual date of project
completion has to get into this gap with a 95.5 percent chance. To calculate
the standard deviation (sigma, σ) and mean (X), we use the empirically derived
formula:
X = (X1 + 4*Х2 + Х3) /6, σ = (ХЗ-Х1) /6,
Where X1-optimistic
value, X2- the most probable value, X3- pessimistic value.
In assessing works the value optimistic, pessimistic and most probable
values - these are three independent variables provided by project team members
who are responsible for budgeting. What principles do we use in determining
three independent values of the cost? Obviously, in the
case of an optimistic value, we consider the rare case when the entire project
goes well. Pessimistic value corresponds to situations in which the performers
manage to step on every rake. In forming the most
probable value, we assume that some of the problems evidenced in the project,
as part of the work has not been implemented. In other words, these three
cases, we estimate the cost for a given task based on the analysis associated
with this task. We describe a method for obtaining
quantitative estimates of optimistic, pessimistic and most probable values of
the project works cost. It is known that the risk is the same work project, as
well as any of the WBS components, in a case that the work might appear, and
may not appear in the course of its implementation. Thus, each risk corresponds to a certain probable value of its
manifestations. In the case of risk manifestations, it becomes a work which
should be performed and is associated with a certain magnitude of cost value -
this value is called "impact risk". In order to further risk analysis and ranking them in importance to the
company and the project, we introduce the third value - the so-called expected risk
value: PI = probable * impact (money units.). Probability of the risk impact
and the expected risk value are used to the compilation of the “estimates of
multiple values". In calculating the
cost of a pessimistic value, we use the magnitude of the effect of all the
risks associated with this work. In calculating the value of an optimistic, we
assume that certain risks in this study will not show up, i.e., the probability
value is 0. In assessing the most probable value, we use
the expected risk value, suggesting that in a real project the risks will be identified
to implement in full effect, some will not occur or will be partially neutralized
to take positive risks (“opportunities”). Turning to a further stage of planning cost, to the budget formation,
we will use the knowledge and presenting of the risks project. In particular,
on the base of the expected risk value, budget for incidental costs develops.
According to the PM methodology, it is the main part of the overall budget project.
Another part of the budget project, the so-called management reserve, put into
the budget in case of manifestation of the unknown (not identified) risks of the
project. It should be emphasized that these risks are necessarily present in
every project, and their proportion depends on which particular area of the
project is implemented. Further management
risk principles are used and the implementation phase of the project - in the
course of tracking the development of the project with the help of favorite
project managers on earned value report. In the classical method of earned
value, we consider the three curves (see Fig. 1), corresponding to three types
of collected data - AC (actual cost), PV (planned value) and EV (earned value).
It is considered that the collected data refers only to two curves - AC and EV,
and projected price is deferred on the basis of the original project plan.
However, as the project is carried out and other risks are implemented or
upcoming, budgeted money of contingency costs and which is shown on the graph
as a fixed quantity of end-point PV curve (budget at completion point),
transferred in the operating budget and is added to the PV curve, showing its
step increase. As a result, changes in the total amount, operating budget and
the position of the point BAC are adjusted.
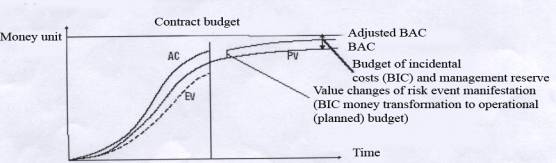
Figure 1. Reports on the earned value
One could consider many other interesting convergence points of risk
management and management cost project. In particular, methods researching of
the project are based on the so-called cost-benefits analysis and reduced to
the analysis of risk tolerance of the company in financial terms for a project
with different levels of profits and other benefits.
At this
place, we would like to stop the argument about the cost characteristics of the
project and proceed to more unconventional aspects of risk management – to the
risks schedule project. Time Management and Project Risk Management: Risk and
scheduling, at first we think of value, that is, monetary risks while reviewing
the project risks. But we should not forget that the on time project
implementation involves certain risks, which in this case can be expressed in
terms of schedule.
Above
we have considered methods of risks account in the final budget for the
project. Whereas we have already postulated integrality of project management
as a methodology, it is easy to assume that such techniques should also exist
in terms of time management.
And
indeed, such methods exist; they are so-called buffer mechanisms for developing
schedules, or buffered schedules. The logic behind this methodology is simple.
From the viewpoint of probability theory to various possible values of the end
of the project corresponds to a probability distribution of occurrence of these
values. If we assume that it is normal, its mode will be located at the point
corresponding to the most probable time of project completion (Fig.2). More
often we use this quantity to promise our clients this or that date of the
project end. However, it is easy to see that for the normal distribution mode
coincides with the median.
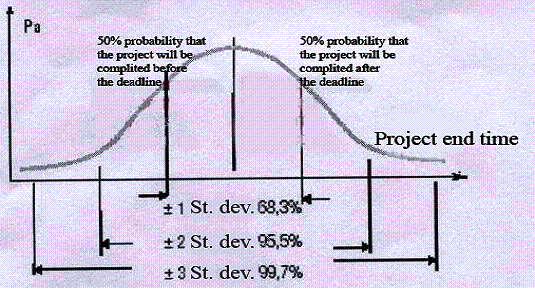
Fig.2
Standard deviation and probability
However,
in real projects the probability distribution of both cost and time of project
completion- usually does not correspond to normal, and is asymmetric to the
right (see Fig. 3). The reasons are obvious: there are much more random factors
leading to a rise in the cost project and increase the duration of its
implementation than the factors working in opposite direction. In other words,
the total value of the "negative" risk is always greater than the
"positive" risks, i.e., "opportunities".
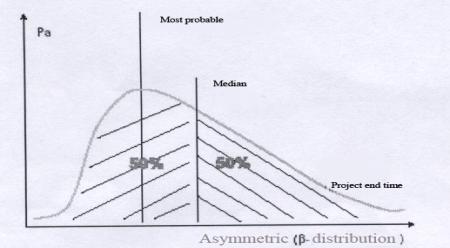
Fig.3
Probable schedule (or budget) distribution.
In this
case, the most probable value is on the left of the median which is usually
represented to our client. Accordingly, the probability of the project
completion after the deadline becomes higher than 50%. Increase depends on the
shape of probable distribution. By analogy with the described above method of cost
project determining, instead of choosing the most probable value, we will focus
on the value that will give us a 95
percent instead of 50 per cent probability that we will be right – viz.,
average + two standard deviations. However, it would be irrational to leave
this extra time at the end of the project. In the case of inevitable
manifestations of these or other risks, all schedules will have to be remade from
the very beginning. Firstly, it becomes difficult for a sufficiently long
duration of the project and a large number of participants, and secondly, it undermines
team’s faith in the manager’s ability of making schedules. For solving this
problem, schedule with the buffer was offered. This method is simple. Float
which neutralized a certain risk events is distributed over the work of the
project in any way. As a base of the buffer allocation is a frequent
probability of risk in a particular work and the degree of exposure. The
Israeli manager Goldratt offered a pretty way in his critical chain theory.
Goldratt’s critical chain – is a standard critical path of the project with
limited resources, i.e., the sequence of project operations, delay
implementation of any of them will postpone the date of n of the project
completion, showing the allocation resources for these works.
All
other works, Goldratt presents in the form of incoming (feeding -
"nursing") chains of the project. In contrast to the standard distribution
method of the buffer on the tasks of the critical path, Goldratt also offers to
calculate the total value 2 & sigma: for each incoming chain. Further it is
offered to plan the schedule according to the dates of the late start and
finish, that is very late dates of the beginning of the work without changing
the time the project ends. According to Goldratt, it gives us the opportunity
to spend much time studying the problem and gathers information before
starting, and thus reduces the potential risks that we may face in carrying out
these works. It’s important to include the planned end date and beginning on
the part of the buffer chain, allocated to this work, in order not to
compromise the work performance of the critical path associated with one or
other input chain. Goldratt's method considers not only risks, breaking
deadline periods of the critical path, but also takes into account the
possibility of delays due to work performance of incoming chains. As the
example of risk management communication, and other project management areas,
we consider one of the most well-known and rather old methods of quality
management. Control diagrams: the use of quality management methodology to
identify the unknown risks of the project during its implementation.
Considering the correspondences between the methods of risk management and
other areas of project management, we touched on identifying, assessing and
responding to risk events. One of the interesting risk management aspects,
which still has not been touched in this article - is a risk control, or
rather, the risk event mechanism of advance notice. Indeed,
we know that risks can be divided into known and unknown.
Resources,
which are necessary to "manage" the emerging risks initially
classified as unknown, are placed in reserve management project. However, it
becomes obvious that the unknown risks let drift and we respond to them only as
the manifestation- approaches are expensive. How to lead events and to obtain information about potential manifested unknown
risks in advance, when there is a possibility to adjust the process without
repeating a number of works? One technique that is applicable in the presence
of an element of the project with a number of relatively repetitive works is
one of a very heavily used method of quality control. Method of control
diagrams in its classical form is used to detect specific factors influencing
the course of repeating the process for some time before the actual
manifestation of these factors and, consequently, the waste in the products. The
observation is based on tracking deviations of fixed characteristics of the
product process from pre-defined intervals, deviations, calculated for a priori
normal process. If the deflection characteristics observed during the receipt
of another batch of the product begin to go beyond certain limits (Fig. 4), or
demonstrate the trend, pointing to the emergence of a factor from the category
of special causes, must adjust the process, prefixing the most negative
consequences. It’s easy to observe that this methodology gives the possibility
of unknown risk exposure, which should be revealed at any project strip, but
the place of its manifestations in advance is unknown. Such risk occasion may
become a reason producing defined changes of the process.
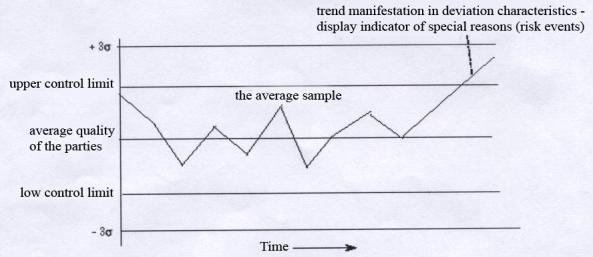
Fig. 4 Example of a control diagram.
We would like to accentuate the basic idea that we have tried to put in
a brief overview of this small article. Project management – is deeply
integrated body of knowledge, characterized by internal interdependence of all
its component parts. Therefore, any work done, connected with budget, schedule,
determining the content and boundaries of the project would inevitably
eventually affect also risk management of the project. If the work in all
aspects of project management done correctly and accurately enough, you will
inevitably have to come to an integrated project plan and to the process it
controls. Any changes made in one of his branches, would affect all the others,
and the data obtained by different independent methods of managing cost,
schedule, quality, project risk would be clearly consistent with each other.
Methods and tools for risk management are associated with complex math
calculations, in fact, can be extremely simple and require a minimum of
additional time and resources.
List of used literature:
1. V.V. Sheremet, B.M.Pavluchenko, V.D. Sharipo and others Upravlenie
inverstisiami: V2.T.1.-M.:Visshaya shkola,1998.-416s.
2. M.I.Knish, B.A.Perekatov, U.P. Strategicheskoe planirovanie
investisionnoi deatelnosti: Uchebnoe posobie.- SP.:Izdatelskii dom
“Bizness-Pressa”,1998.-315s.
3.S.U.Surov, N.U.Surova Investisionnii menegment:Uchebnoe posobie.-M.
“Prrior-izdat”,2004.-144s.