Askhat Azhikhanov
PhD student, Institute of Economics and Business,
Kazakh State Technical University Satpayev K.I. (Almaty, Kazakhstan),
e-mail: Askhat@ababank.com
Tel: + 855 23225333 (office),
+ 855 98890777 (mobile), +855 23216333 (fax)
Abstract
The primary objective of this research is to investigate the earnings -
price relationship in the frame of the event study methodology. Using the
sample of 30 Small Cap and 30 Large Cap companies publicly traded on the London
Stock Exchange Main Market the study finds that Small Caps companies do react
stronger to Good and Bad news announcements, while Large Caps companies are
less responsive to these events.
Key words: stock, earnings
news, price, stock returns, small and large cap companies
Introduction
Earnings – price relationship is one of the most robust anomalies in
asset pricing literature. It is characterized as the continuance of abnormal
returns in the direction of earnings news after earning announcements. Early
studies try to interpret earnings – price relationship in the context of
efficient market theories (EMT) but fail to fully account for the observed
price drift. Recent research works have leaned toward behavior finance and
attribute the cause of earning – price anomalies to investors under – reaction
to earnings news (e.g. Bernard and Thomas (1989, 1990), Barberis, Shleifer, and
Vishny (1998), and Daniel, Hrsleifer and Subrahmanyam (1998))
The key implications for the accounting and finance research and policy
from the analysis of EMT were the following: first, financial statements are
not the only source of information for making investment decisions; second, and
more important, no trading advantages accrue to users of financial statements
because the information contained in them is instantaneously incorporated in
prices as soon as the information becomes public.
Modern Portfolio Theory (MPT) and Capital Asset Pricing Model (CAPM)
contributed extra ideas, implying that since the expected return for a given
firm does not depend on risks that can be diversified away, information
regarding the outlook for a specific firm was largely irrelevant. The only
thing that mattered was the systematic risk of the firm and its relationship to
the total portfolio. Furthermore, CAPM and MPT influenced accounting theory
development by providing a model to measure the reaction of market returns and
earnings. Deviations from expected earnings could be shown to influence the
realised rate of return or, more specifically, the unexpected portion or
abnormal return.
All this led to the so-called market-based research studies that can be
classified into the following categories:
§ Tests of the EMT
versus classical approach
§ Tests of the
informational content of accounting alternatives
§ Tests of the
earnings/return relationships
The focus of my work is to test the earnings/return relationship in the
frame of the event study methodology. I will therefore proceed in the following
way: firstly, I will briefly review the landmark research papers that are
directly relevant to the questions I am attempting to answer. Secondly, I will
formulate my own hypothesis test and describe the methods and data set I intend
to use during my analysis. Thirdly, I will conduct the tests, describe the
obtained results and try to interpret deviations from the hypothesis. Finally,
I will summarise my findings and suggest if any further tests should be carried
out in the following area.
I. Theory and
empirical evidence
I will start my review of the research literature from the 1968 paper by
Ball and Brown that is thought to be the first comprehensive attempt to analyse
the earnings/price relationship. The two academics partitioned the firms in
their sample into good news/bad news groupings. Based on a firm’s reported
earnings, a company was classified as reporting good (bad) news if the reported
earnings were above (below) those predicted by a time-series forecasting
models. Based on this classification, two portfolios were constructed. The
findings were summarised in the comparison of the cumulative return of the
“good news” portfolio versus “bad news” portfolio. Good news firms enjoyed on
average abnormally positive returns, whereas bad news firms experienced
abnormally negative returns. By this research Ball and Brown demonstrated a
clear association between earnings and stock market reaction.
These results, as it often happens with empirical studies, have raised
more questions than were answered. Ball and Brown estimated that 80% to 85% of
the abnormal market performance occurred prior to the publication of the annual
report. This suggests that although earnings are meaningful measures of a firm’s
financial performance, by the time they are published they are outmoded and
have little or no market impact.
The market anticipated of reported earnings raised questions about the
timeliness of annual reports, and spurred a series of studies intended to examine
the “information content” of accounting data, which is measured by market
reaction to the announced earnings and its deviation from the expected
earnings.
To date, studies of the earnings/return relationship are among the most
widespread form of market-based research. Some research conducted in this area
was very broad in scope; some simply replicated the previous studies, with an
emphasis on methodological refinement. But all in all, there has not been
achieved rounded understanding of the role of accounting earnings in the
stock-return generating process.
The nature of the research can be classified based on the initial study
by Ball and Brown into:
§ Accounting variable
§ Market-based
variable
§ Tests of the
relationship between good news/bad news parameter and abnormal returns
Let us look in more detail into these three groups.
1)
Accounting variable
Ball and Brown used the sign of forecast error of annual net income and earnings
per share (EPS). Other researchers, like Beaver at al., considered the magnitude
of the error. Further, Foster examined quarterly earnings and found that
quarterly reports also possess information content.
However, a later research by Ball (1978) began to document
postannouncement drift, where positive (negative) abnormal return patterns
continued for some time after the announcement of good (bad) news quarterly
earnings.
2)
Market-based
variable or measurement period for market performance
Ball and Brown examined monthly returns over full year. Other studies,
depending on the issue analysed, used weekly (or daily) returns in the periods
immediately surrounding the announcement. The trade-off between using narrow
versus wide windows is that in the former case there is less risk that the
market could be reacting to information other than that being tested.
3)
Test of the
relationship between good news/bad news parameter and abnormal returns
Early studies, as I already mentioned above, grouped firms into good
news and bad news portfolios based on the sign or magnitude of the earnings
forecast error. Later studies explicitly related the response of stock returns
to earnings by the introduction of the earnings response coefficient (ERC).
The ERC is the coefficient b
in the regression equation R = a +
b∆E, where R and ∆E measure returns and earnings
change (growth) respectively. ERCs were typically found to be much lower than
expected.
ERC studies tested for differential reaction across firms and to various
components of earnings. Collins and Kothari (1989), for example, show that risk
and growth variables explain some of cross-sectional differences in ERCs.
Critical evaluation of
research findings
Despite the fact that many of the research papers tested relationships
that have not been tested before, many, like Lev, were critical to the prior research
results because they contribute to neither:
·
An understanding of how and to what extent earnings are used by
investors, nor
·
The debate of accounting policy makers
To a great extent, they attributed this failure to a fixation on the
part of researchers on sophisticated statistical techniques at the expense of
specification of fundamental relationships. This means that studies with
statistical significance often exhibited little or no economic significance.
For example, it was revealed that studies that examine the earnings/return
relationship tended to report low R2. On average, earnings could explain no
more than 5% of the variation in returns.
As a result of these criticisms, Lev, among others, suggested a more
enhanced approach to the research of return/earnings relationship that should
incorporate the following elements:
·
More careful analysis of valuation models as they relate to accounting
and earnings
·
Measuring earnings/return relationships on an individual basis rather
than portfolio basis
·
Averaging reported earnings over time and examining longer time horizons
·
Earnings components used in the research should incorporate all possible
adjustments in order to arrive at a more comprehensive and meaningful analysis.
When discussing the shortcomings of the research in the area of
earnings/return, I have to mention a number of discovered market anomalies that
question the validity of the EMH and some of the conclusions from the research
papers mentioned above. Below are a few of these market anomalies:
·
Monday effect. After the weekend, marker prices tend to open at lower
levels, suggesting an advantageous strategy of selling short at the Friday
close and covering the short position Monday morning. This anomaly is often
used by companies that make their earnings announcement after the Friday close.
·
Price-Earnings Ratio. Firms with low P/E ratios tend to outperform the
market even when returns are adjusted for risk.
·
Size effect. Smaller firms (measured by total assets or total
capitalisation) tend to outperform the market even when returns are adjusted
for risk.
·
The size effect is often attributed to the fact that fewer analysts
follow smaller firms than larger firms. Thus, not all information available
about these firms is immediately incorporated in stock prices, leaving room for
abnormal returns to be earned by those who trade on this information early
enough.
·
Post announcement drift. The EMH holds that stock prices adjust
instantly to new information. Empirical evidence, however, suggests that price
changes persist for some time after the initial announcement. In addition, some
researchers found the drift to be less pronounced for stocks having large
institutional holdings. However, little relationship was found between investor
sophistication and abnormal returns.
·
Over reactive markets: Contrarian Strategy. If the stocks were ranked by
their performance over a previous five-year period (the base period), those
firms with the worst base-period investment performance outperformed those
firms with the best base-period performance over the next three years. This
suggests that markets overreact.
This argument was further extended showing that when a firm’s earnings
decline, the market overreacts, driving the price down (and the book-to-market
value up) sharply. Similarly, when a firm reports good earnings, the market
chases the stock price up (and the book-to-market value down). Over time, the
extent of overreaction becomes clear and prices reverse, yielding
above-(below-) average returns for high (low) book-to-market firms.
I would like to conclude my brief review of research works in the area
of earnings/price by describing another study, by Ou (and later by Ou and
Penman), because their research contrasts Ball and Brown, discussed earlier.
Ou, similar to Ball and Brown, divided firms into good- and bad-news
categories, based on the previously reported earnings. The researcher then
added forecast earnings into the picture (derived from the regression using
eight variables, various accounting measures), which resulted in the formation
of four portfolios.
|
Portfolio |
Reported this year |
Predicted next year |
|
E+F+ |
Good news |
Good news |
|
E+F- |
Good news |
Bad news |
|
E-F+ |
Bad news |
Good news |
|
E-F- |
Bad news |
Bad news |
This research is different from many other studies mainly for two
reasons. First, the analysis is not motivated to show whether accounting
information is associated on an ex post basis with market prices, but rather
whether the information can be used ex ante as a basis for valuation. Second,
Ou broadens the set of accounting information by utilising the tools of
fundamental analysis (meaning that more attention was paid to changes in
accounting policies, ratio and warning signals analysis).
In the following research Ou and Penman tried to see whether a trading
strategy based on earnings forecast could prove to be fruitful. It was: the
average market-adjusted return was 14.5% per annum over a 24-month holding
period.
Finally, I would like to stress that approaches used by Ou and Penman as
well as by other researchers do not use fundamental analysis itself. In turn,
they rather utilise some of its tools. Fundamental analysis requires more
in-depth analysis, the nature of which varies from firm to firm. This important
attribute is missing from these studies, and this makes approaches used by many
academics significantly different from market practitioners like company
analysts.
II Sample, hypothesis and
methodology
In this section, I first discuss the data, hypotheses and then present
methodology I used to test these hypotheses.
Data
As the aim of this course work is not to conduct a comprehensive
research study, but rather to demonstrate understanding of the earnings/price
anomaly, the choice of the firms included in my sample as well as questions
raised are not new for the academic thought.
I work with the sample of 60 companies, a half of which are small-cap
firms and another half are large-cap firms. All companies are publicly traded
on the London Stock Exchange Main Market. The sample was created based on the
market capitalisation of firms: I opted for 30 top and 30 firms with
capitalisation below ₤100 million in the list, excluding the financial
companies.
The share price information and FTSE ALL SHARES Index return was
obtained using Bloomberg and Datastream databases. “Event”, which is the
announcement day of the annual earnings (results) of the firm, was sourced from
Bloomberg and London Stock Exchange. Both the actual and expected EPS were
provided by Bloomberg.
The events in the sample cover the period from 2005 to 2006. Narrowing
the sample to 1 year I intend to avoid discrepancies due to market sentiments –
the period from 2004 to 2006 period was characterised by predominantly bullish
mood with short periods of bearish behaviour.
Annual reports used for interpretation of the earnings/price
relationship were obtained from the companies’ websites or from the Bloomberg
database.
Hypothesis
I have formulated my hypotheses in the following way:
·
The share prices of the companies with earnings announcements above the
market expectations exhibit increase in the prices by percentage of earnings
surprise.
·
The share prices of the companies with earnings announcements below the
market expectations exhibit decrease in the prices by percentage of earnings
surprise.
·
Small-cap firms react stronger to positive (negative) announcements than
large-cap firms.
In expanding my analysis, I further examine the market
over-reaction and under-reaction to positive (negative) earnings news,
as well as, market reaction to non-earnings information.
Methodology
In this paper I use the standard event study methodology to assess the
market reaction to the earnings announcement.
The incorporation of earnings information tested within the 21-day
period, 10 days before the announcement and 10 days after the announcement. The
reason for that selection is the fact that there can be insider trading or
leakage in the market and the market can react prior the day of the earnings
announcement. I also use the longer event window in order to analyse the post-earnings
behaviour of the share price and examine the market over-reaction and
under-reaction to positive (negative) earnings new. At the same time, in order
to capture the price effects of announcement, I use following event window (-1,
0, +1), where 0 represents the earnings announcement day. I include day -1 and
+1 due to the fact that earnings announcement reported in various sources. As a
result the information may have been incorporated in share price not only on
day 0, but also on day -1 and +1depending on the sources (e.g. broker, news
media, etc.).
In order to calculate the abnormal return I use FTSE ALL SHARES index
return as a benchmark return. In this case I assume that the share prices move
in the same way and proportion as the index. Thus, the abnormal return was
calculated for each day and event as the daily log return of each company minus
the daily log return of FTSE ALL SHARES index for the same period.
![]() E(Ri) = Rmt ARit =
Rit - Rmt
E(Ri) = Rmt ARit =
Rit - Rmt
The price reaction on the earnings announcement was measured by the
three day cumulative abnormal return (CAR 3 DAYS) and calculated as the sum of
abnormal daily return of each company over the following event window (-1, 0,
+1). In order to examine the market over and under reaction I also calculate
the post announcement cumulative abnormal return (CAR POST) as the sum of
abnormal daily return for the post announcement 10 days, excluding abnormal
return of the first day (+1). This result will be compared with the CAR3 days
around the day of announcement. If:
1.
CAR3 days > CAR POST – then I observe over-reaction to the
announcement;
2.
CAR3 days < CAR POST – then I observe under-reaction to the
announcement.
In order to investigate the influence of the earnings announcement on
the share price I analyse the sign of unexpected earnings change, i.e.
deviation of the actual earnings from the expected earnings (earnings
surprise). I do not observe the deviation of the actual earnings from the
actual earnings the prior year, assuming that all the information about the
company is available during a year and most of the content of annual report
(about 85 to 90 percent, Ball and Brown 1968) already incorporated in share
price based on 3 interim reports. Thus, what really affects the share price on
the day of earnings announcement is unexpected earnings change or Earnings
Surprise. To calculate Earnings Surprise I use following formula:
Earning Surprise =![]()
In this case, if the actual returns are higher than the estimated ones,
then I can consider this news as positive news and the opposite, if the actual
are lower than estimated.
I further split the two broad samples of small and large cap companies
into three new sub categories based on the sign of earnings surprise: Good news,
No news, and Bad news. I categorize the news according to the deviation of the
actual earnings from estimated.
·
2.5% increase, considered Good News Event;
·
2.5%< Inc < -2.5%, considered No News Event;
·
< -2.5% decrease, considered Bad News Event.
In order to compare these sub categories, I further calculate average
cumulative abnormal return for each category, within two broad portfolios of
small and large cap companies.
Hypothesis testing
My hypothesis for all three portfolios, categorized by the type of event
is:
H0: the AAR on the first day after the announcement are insignificantly
different from 0.
H1: if the 0 is rejected the event has positively (Good News Portfolio),
negatively (Bad news Portfolio) or did not affect at all (No news Portfolio)
AAR across companies on the second day after the announcement of the Event.
To test the t-statistic, abnormal returns must be aggregated across all
firms and the standard error has to be calculated. The average abnormal return
across firms (AARt) for a sample of N firms at each time t within the event
window is given by:
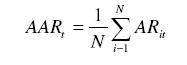
Where AR it = Abnormal return for stock i at time t
N = Number of events in the sample
The t-statistic for the null hypotheses that aggregated abnormal returns
are equal to
zero is:
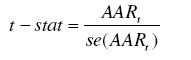
Where AAR t se = Standard error of AAR at time t
The standard error is calculated by dividing the standard deviation of
the abnormal returns into the square root of the number of events in the
sample. The t-test is a two tailed test at 5% significance level, with the
critical value taken from the t-statistic with n-1 degrees of freedom.
In my case, as the number of events in each portfolio is equal to 1,
t-stat will be calculated dividing the AARt by the SD.
In order to examine the magnitude of changes in share price (CAR 3 DAYS)
and changes in earnings (Earnings Surprise), as well as, correlation between
CAR 3 DAYS and Earnings Surprise, I build ordinary least squares regression
model using E-View program.
Finally, to analyse market reaction to non-earnings information and
taking into the account that Earnings Surprise may not adequately explain the share
price deviations, I include in my research a number of widely used factors that
may affect on the stock market reaction, such as:
·
Changes in dividend policy (dividend per share ratio);
·
Share buy back;
·
Target-Bid Announcement;
·
Changes in Sales growth;
·
Changes in Leverage;
·
Changes in Gross Profit Margin;
·
Changes in EBIT;
·
Changes in Liquidity;
·
Changes in Corporate Governance;
·
R&D.
III. Test results and their
interpretation
The earnings announcement sample illustrates the use of the abnormal and
the cumulative abnormal returns. The results of this research shows a plot of
the cumulative abnormal returns (CAR’s) over the entire 21 days of all three
company categories, Good News Event, No News Event and Bad News Event. ![]()
![]()
![]() The observations
support the hypothesis that earning announcements do indeed convey useful
information for the valuation of Small Cap firms. The result demonstrates that
the information contained in the good-news earnings announcement is useful in
that if good-news has been detected, the market follows in the same direction.
This is consistent with evidence found in the literature, Ball and Brown
(1969). Bad-news findings do match with my expectations as well. However, the
no-news findings follow a random walk, which also says that the market reacts
to no change-in-earnings information and there are other factors which also
influence the performance of the share price. For example, the Figure 2 shows even
higher volatility in the reaction of the No-news portfolio returns, and Large
Caps, being more transparent in their Corporate Governance submit dozens of
other qualitative news to the market such as M&A activity, corporate
restructuring etc.
The observations
support the hypothesis that earning announcements do indeed convey useful
information for the valuation of Small Cap firms. The result demonstrates that
the information contained in the good-news earnings announcement is useful in
that if good-news has been detected, the market follows in the same direction.
This is consistent with evidence found in the literature, Ball and Brown
(1969). Bad-news findings do match with my expectations as well. However, the
no-news findings follow a random walk, which also says that the market reacts
to no change-in-earnings information and there are other factors which also
influence the performance of the share price. For example, the Figure 2 shows even
higher volatility in the reaction of the No-news portfolio returns, and Large
Caps, being more transparent in their Corporate Governance submit dozens of
other qualitative news to the market such as M&A activity, corporate
restructuring etc.
At the same time, I have observed a high volatility of returns for my
Small Caps after the announcement day, which is consistent with most academic
studies and reflects their higher risk and lower liquidity.
Analyzing results of my test, I also observe that the evidence doesn’t
support completely the hypothesis that earning announcements convey information
for the valuation of Large Cap firms. The results demonstrate that the
information contained in the good-news earnings announcement is useful in that
if good-news has been detected, the market follows in the same direction with
small overreaction at the beginning. Bad-news findings do not match with my
expectations and no-news findings follow a random walk.
The test shows lower volatility of returns for Large Caps Good and Bad
news after the announcement day. This is consistent with most academic studies
and reflects lower risk and higher liquidity of the stocks.
Finally I find that Small Caps do react stronger to Good and Bad news
announcements, while Large Caps are less responsive to these events. This is
consistent result with my 3 hypothesis.
Small Caps T-test: The return is
reflected in the t-test with a significant t-observed of +2.39 at day one for
Good News Portfolio. The significance of the result means, rejecting the null
hypothesis that the given event has no impact on security prices. Thus, I
examine evidence that the market was surprised by the good-news of the
company’s earnings announcements and has adjusted to the bad and no-news, which
are both significant. Otherwise, the market expectations would have been
included in the stock prices prior the announcement.
If the investor would have put his money 1 day prior the event into the
good News portfolio, he would have achieved a 2.62% excess abnormal return over
the FTSE All Shares Index after the event.
Large Caps T-test: The return is
insignificant at day one for Good News Portfolio; though it follows the sign of
the event. The insignificance of the result means, accepting the null
hypothesis that the given event has no impact on security prices. The market
was not surprised by the good-news of the company’s earnings announcements and
has reacted positively to the Bad and No-news announcements, which are both
significant.
To check, if proxies mentioned in Part I of this paper can explain the
behaviour of my stock prices I have run a number of regressions:
·
Between CAR3 and Earnings Surprise and found R-squared of around 21% for
Large Caps and R-squared of around 25% for Small Caps. This confirms the results
of t-stat test and presence of other factors;
·
Unsatisfied by the explanatory power of this factor I include a number
of other factors and get a maximum R-squared of around 46% for Large Caps and
R-squared of around 40% for Small Caps which is still low.
Under and over reaction. Analysing this
part of the research I find a clear higher over reaction for Good news
portfolio of Small Caps, no excessive reaction for No news portfolio and less
under-reaction for Bad news portfolio. Investors seem to be over optimistic for
Good news and respond less to Bad news.
The results show under-reaction for Bad news and No news portfolios,
which adapt lately and irrelevant behaviour of Good news portfolio. For my
Small Caps portfolio Earning announcements are often one of the few sources of
information and investors respond to these news behaving irrational. At the
same time Large Caps produce more data and news as I have mentioned before and
market seems to be prepared and this information is already incorporated in the
share price.
Ball, in his 1992 paper “The earnings-price anomaly”, looked at various
reasons, provided by researchers to explain the persistence of the
earnings-price anomaly (e.g. the drift in the market response to earnings
announcements, implications of financial statements information for future
earnings and abnormal returns). He found that most of them do not adequately
explain the deviations. However, he accepted that the problems could come in
bundles, which are difficult to estimate.
Interpretations of earnings/price anomalies:
1)
CAPM beta risk. Beta estimation error could be correlated with earnings.
2)
Transactions costs.
3)
Liquidity and trading mechanism effects. Increase in abnormal returns
during the periods of illiquidity.
4)
Overstated t-statistics. Systematic understatement of standard errors of
various statistics by researchers.
5)
Earnings variables proxies for expected returns. Either CAPM or the
empirical market portfolio used in its implementation is misspecified, and the
independent variables proxy for errors in estimating expected returns.
6)
Substantial information production costs or market inefficiency?
Substantial costs of information acquisition and/or processing would be
encountered in implementing the trading rules simulated by researchers.
7)
The inefficient-markets hypothesis. The market-inefficiency explanation
requires prices to systematically provide unexploited pure-profit opportunities
from using accounting information.
I consider most of the factors stated above to be relevant for my portfolio,
which can explain deviations from the hypothesis.
Conclusion
The results revealed that my first hypothesis, positive earnings
surprise should be followed by increase in the share price, can not be rejected
for Small Caps portfolio which show positive and significant returns after the
day of announcement of annual results and should be rejected for the Large Caps
portfolio, which shows positive but insignificant CAR3.
Second hypothesis for the bad-news events can’t be rejected for Small
Caps portfolio, for which the annual results are sometimes one of the few
sources of information. Though, it can be interpreted differently for the Large
Caps, which show positive and significant result. Investors will have
incorporated the news provided in their security prices already. Over their
whole investment period they take different sources like interim reports and
other market data into consideration. The bullish stance has also prevailed
during the examined period among investors, who were overoptimistic.
Third hypothesis that Small-cap firms react stronger to positive
(negative) announcements than large-cap firms can’t be rejected as well and is
well-shown on the graphs. Risk and liquidity parameters have probably affected
higher volatility.
I examined the market over-reaction and under-reaction to positive
(negative) earnings news, as well as, market reaction to non-earnings
information and found that this seems to be the case for Small Caps portfolio
and partly inconsistent in the case of Large Caps portfolio.
Since I found different factors, which can explain stock price
behaviour, more work has to be done to better understand the strategic
decision-making of the investors and to explain factors, which drive the
performance of the share price.
1)
Ball and Brown, "An Empirical Evaluation of Accounting Income
Numbers", Journal of Accounting Research, 1968, 6(2), pp. 159-78.
2)
Ball and Kothari, "Security Returns around Earnings Announcements”,
Accounting Review, 1991, 66(4), pp. 718-38.
3)
Ball, “The Earnings-Price Anomaly”, Journal of Accounting and Economics,
1992, 15(2-3), pp. 319-45.
4)
Ball, Kothari and Ross, "Economic Determinants of the Relation
between Earnings Changes and Stock Returns", Accounting Review, 1993,
68(3), pp. 622-38.
5)
Bodie, Kane and Marcus, Investments, 4th ed., Irwin McGraw Hill, 1999.
6)
Foster, Financial Statements Analysis, 2nd ed., Prentice Hall, 1986.
7)
Lasfer, “Research Project Management”, 2006, lecture notes.
8)
Lasfer, “Security Analysis”, 2006, lecture notes.
9)
Lev, “On the usefulness of Earnings and Earnings Research: Lessons and
Directions from Two Decades of Empirical Research”, Journal of Accounting
Research, 1989, pp.153-192.
10) Ou and Penman,
“Financial Statements Analysis and the Prediction of Stock Returns”, Journal of
Accounting and Economics, 1989, pp. 295-329.
11) Ou, “The
Information Content of Nonearnings Accounting Numbers as Earnings Predictors”,
Journal of Accounting Research, 1990, pp. 144-162.
12) QI Sun, “Stock
Price Reaction to Earnings Announcement Drift”, Working paper, School of
Business Administration, University of Wisconsin-Miwaukee, 2005
13) Winkelmann, “The
Impact of Earning Announcements on Security Returns: An Analysis of German
Mid-Cap Companies listed in the MDAX”, Dissertation, Cass Business School,
2002/
14) Bloomberg database
15) Datastream database
16) Thompson Financial
17) London Stock
Exchange: www.londonstockexchange.com
18) Companies’ websites