Economic
sciences/2.International activity
Natalia Lashkevich
Master of Economics, PhD-candidate of the University
“G.d’Annunzio” Chieti-Pescara, Italy e-mail:
lashkevich.n@gmail.com, priorpost@mail.ru.
Food risks in
imported wheaten pasta into
the EU Pasta
Market.
Summary
The EU Single Pasta Market is characterized of steady
growth of imports during 2001-2011 years, the increase notifications about food
hazards. The regression analysis allowed to identify a correlation and
relationship between pasta imports and food risks. More perspective measures to
strengthen the food safety policy of the EU is to improve border quality
controls.
Keywords: the
EU, pasta, imports, food risks, correlations.
Introduction
The globalization of the food trade offers many
benefits to consumers, as it results in a wider variety of commodities.
However, these changes also present new challenges of the food safety during
the production and distribution and have been shown to have widespread
repercussions on health. [1] In industrialized countries, the percentage of the
population suffering from foodborne diseases each year has been reported to be
up to 30%. [2] So, the interest in the safety of imported foods has increased
over time. Foodborne diseases not only significantly affect people's health and
also they have economic consequences for countries. The Economic Research
Service of the USDA estimated the cost of foodborne illnesses pathogen-challenged.
The cost a foodborne illness is challenged by Salmonella is 2.708.292.046$ in
2010.[3] Therefore food risks must be controlled
and managed constantly.
Food risks in imported
wheaten Pasta into the EU Single Market
Borders of the EU have increased during the last
decade and now it includes 27 Member States. This tendency of globalization
leads to the liberalization of trade relations between countries. Taking into
consideration the importance of the economic consequences of foodborne
illnesses the analysis of the EU Pasta Market has implemented in a framework of
correlation “trade flows – food risks”.
During 2001-2011 years the RASFF system received 166
notifications about the presence food safety risks in wheaten Pasta which was imported,
exported and consumed at the EU single market. [4]
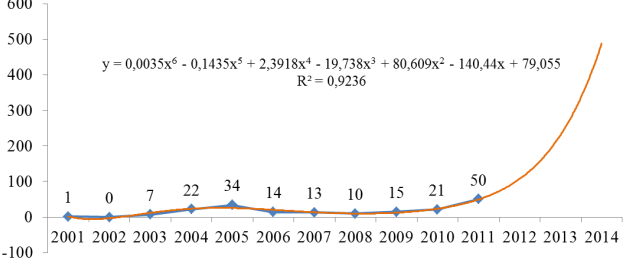
Figure 1 Dynamic food risks of wheaten pasta
The graphic 1 demonstrates fluctuations: peak of food risks
was in 2005 and 2011 years; the growth of notifications since 2003 till 2005
and since 2009-2011. So, the general tendency of last three years is the
increase of food risks.
For the forecast a situation in analyzing food safety
area the polynomial of the sixth degree was built. The got trend line shows the
steady growth of food risks in 2012-2014 years.
Table 1 Food
risks in wheaten pasta
|
year |
biocontaminants |
mycotoxins |
microorganisms |
radiation |
xenobiotics |
control |
compositions |
adulteration (import rules) |
Total |
||||
|
aluminium |
(detergent) |
org asp |
control |
ingradients |
trans fatty acids |
food additives |
|||||||
|
2001 |
|
|
|
|
|
|
|
|
|
|
|
|
0 |
|
2002 |
|
|
|
|
|
|
|
|
|
|
|
|
0 |
|
2003 |
|
|
|
|
1 |
|
|
|
|
|
4 |
|
5 |
|
2004 |
|
|
|
1 |
|
|
|
|
|
|
17 |
|
18 |
|
2005 |
|
|
2 |
|
|
|
|
|
|
|
27 |
|
29 |
|
2006 |
2 |
2 |
|
6 |
|
|
|
|
1 |
|
3 |
|
14 |
|
2007 |
1 |
2 |
1 |
1 |
|
1 |
|
|
1 |
|
6 |
|
13 |
|
2008 |
1 |
1 |
|
|
|
|
|
|
|
|
4 |
|
6 |
|
2009 |
3 |
3 |
|
|
2 |
|
|
|
1 |
|
4 |
|
13 |
|
2010 |
1 |
1 |
2 |
|
5 |
|
1 |
1 |
3 |
1 |
3 |
|
18 |
|
2011 |
2 |
2 |
2 |
6 |
33 |
|
|
|
1 |
|
3 |
1 |
50 |
|
Total |
10 |
11 |
7 |
14 |
41 |
1 |
1 |
1 |
7 |
1 |
71 |
1 |
166 |
|
Total by cluster |
10 |
11 |
7 |
14 |
42 |
2 |
79 |
1 |
166 |
||||
|
Share of cluster |
6,02 |
6,63 |
4,22 |
8,43 |
25,30 |
1,20 |
47,6 |
0,60 |
100 |
||||
Table 1 shows the list of food risks in wheaten pasta by
hazard and frequency. The group of risks “compositions” takes the most share among
the total notifications – 47,6% (or 79 notifications). The share of
“xenobiotics” is 25,3% (or 42). Such food risks as “biocontaminants”,
“radiation”, “mycotoxins” and “microrganisms” have low level of frequency,
because its share is situated in the interval 4-9%. Notifications about “controls”
and “adulteration” were received very seldom; its share is 1,2% and 0,6%
respectively. The database of food risks in wheat pasta presented in table 1
allowed to admit: 1) the information about such food risks as “food additives”,
“biocontaminants” and “mycotoxins’ was received constantly; 2) slump of food
risks “food additives” was since 2006 year; 3) sharp peak of “xenobiotics”
(here – “aluminium”) was in 2011 year.

Figure 2 Ranking origin countries of pasta by share in
total food risks
The analysis and ranking (see figure 2) notifications
by origin country showed the more “harmful” countries are China (29,52%) and Italy
(24,7%) and then Hong Kong (8,43%), Netherlands (8,43%), Thailand (6,02%), Viet
Nam (3,61%). The frequency of notifications about the presence food hazards in
pasta exported from other countries at the EU single market is very low, namely
1-2%.
To assess a correlation between food risks and the
Extra-EU trade at the EU Pasta Market, the regression analysis has used. In
order to identify the relationship between these variable – food risks and the
Extra-EU imports – table 2 with data was created.
Table 2. Database
for the regression analysis.
|
Year (n) |
2001 |
2002 |
2003 |
2004 |
2005 |
2006 |
2007 |
2008 |
2009 |
2010 |
2011 |
|
Food risks (y) |
0 |
0 |
5 |
18 |
29 |
14 |
13 |
6 |
13 |
18 |
50 |
|
Extra-EU imports,ThT
(x) |
83,3 |
97,5 |
102,4 |
118,9 |
125,7 |
134,2 |
157,5 |
171,1 |
181,4 |
181,9 |
199,7 |
Source: [4], [5]
y(x) = 0,22x-16,28
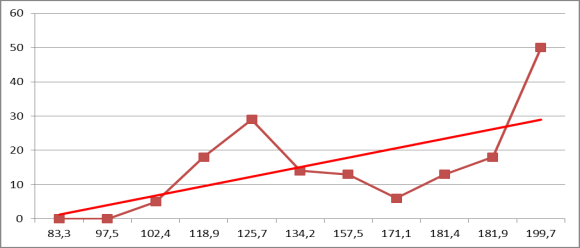
Figure 3. Regression line
The regression
analysis showed that there is a correlation between imports and food risks,
because the regression coeffitient (rxy) is 0,605 and the
coefficient of determination R2 is 0,365. The use of the regression
equetion y(x) = 0,22x-16,28 allowed to estimate the predicted level
of food risks depended of predicted volume of imports. The results is presented
in table 3.
Table 3 Predicted food risks
in predicted pasta imports at the EU Single Market
|
Variable |
Value |
||||||
|
Imports, ThT |
xp |
200,0 |
210,0 |
220,0 |
230,0 |
240,0 |
250,0 |
|
Food risks |
yp |
28,14 |
30,36 |
32,58 |
34,80 |
37,03 |
39,25 |
Table 3 shows the growth of food risks with the
parallel growth of imports. So, in order to protect the european consumers it
is necessary to improve food safety and quality control measures.
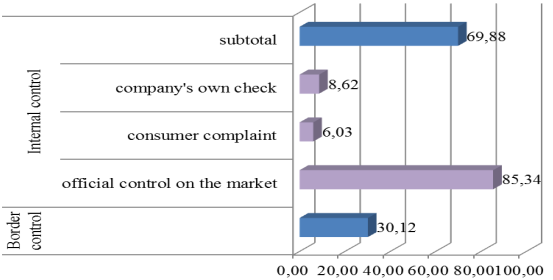
Figure 4 Structure of the EU controls
The analysis of the EU’s control activity presented at
the figure 3 showed that internal controls play a key role in order to ensure
the food safety and prevent food risks. And such type of controls as “official
control on the market” takes the first place in the control activity at the EU
single market. Hence, in order to ensure steady food safety situation at the EU
single market it is necessary to strengthen the national food quality and
safety control and monitoring systems.
Conclusions
Processes of world globalization and integration
affect on international trade influence on the food safety situation at the EU
food markets.
The analysis trade tendencies at the EU Pasta Market
showed that pasta imports were increased annually during 2001-2011. Built
regression line and calculated coefficients (of correlation and determination)
confirmed a relationship between the volume of pasta imports and the level of
food risks.
Presented structure of food risks allowed to admit the
most “harmful” pasta imports were from China and Italy.
Such type of food safety and quality monitoring as
“official controls” has played a key role in the protection of consumer
consumption in order to prevent foodborne illnesses. So, to heighten the
protection of the EU internal markets in the food safety area, it is necessary
to continue to develop the internal controls and to strengthen the border
quality and safety controls.
References:
[1] ASSURING FOOD SAFETY AND QUALITY: GUIDELINES FOR
STRENGTHENING NATIONAL FOOD CONTROL SYSTEMS // Joint FAO/WHO Publication
[2] Fact sheet N°237 Reviewed March 2007 / WHO
[3]Foodborne Illness Cost Calculator [e-source] //
http://www.ers.usda.gov/Data/FoodborneIllness/
[4]Notifications list [e-source] https://webgate.ec.europa.eu/rasffwindow/portal/
[5] Eurostat. International trade. [e-source] http://epp.eurostat.ec.europa.eu/portal/page/portal/international_trade/data/database