Ecology/6. Ecologic
monitoring
Postgraduate
student Rodriges Zalipynis R.A.
Donetsk National Technical University, Ukraine
Risks of air pollution by aerosols
over the territory of Europe
Abstract. For the first time, using satellite Earth remote sensing data, the maps
of air pollution risks by aerosols over the territory of Europe with spatial resolution
of 1.0º×1.0º (approximately 110 km × 72 km for the 48º
latitude) were created. The presented risk calculation technique is simple yet delivers
extensive understanding of air pollution character. It is shown that the
highest levels of air pollution by aerosols in Europe are observed over the
north of Italy. The stripe is identified over which the highest risk
levels of air pollution by aerosols are found over the rest of Europe.
Keywords: Earth remote sensing data,
atmospheric air, aerosol optical thickness, time series, maps of risk, Europe
Introduction.
Today,
air pollution data come mainly from the network of ground-based stations the
majority of which are located in large cities. The stations deliver point measurements
of pollutant concentrations on the height of up to 10 meters over the sea level.
In several countries, including Ukraine, aerosols are not measured at all
(except of suspended dust). Chemical reactions, air transport of pollutants in the
atmosphere and other factors lead to low reliability of the results of
numerical modeling in the areas without air quality control stations. It is impossible
to obtain a complete and consistent picture of air pollution over the whole
territory of Europe using scattered data from ground-based stations.
Satellite Earth remote
sensing data provide atmospheric pollutant concentrations with high spatial and
temporal resolution. Today, these data are not widely used for solving practical
tasks of ecologic monitoring due to extremely high complexity of accessing to
them, their visualization and analysis.
Modern ecologic monitoring
complex provides new opportunities not available before for solving urgent
tasks of environmental protection [1]. The instruments it provides made
possible to create maps of air pollution risks by aerosols over the whole
territory of Europe using satellite Earth remote sensing data.
High resolution maps
of air pollution risks allow to answer many important questions in the domain
of ecologic safety. For example, what countries have the highest level of air
pollution and what is the relative level of air pollution between different
regions inside a country.
Related work. Due to NASA initiatives for providing
free of charge remote sensing data, for instance [2], active research is carried
out of aerosol optical thickness (AOT) all over the Earth. AOT trend analysis is
carried out, including for the atmosphere of Europe [3], aerosol concentrations
obtained from satellite radiometers and ground stations are compared [4]. The most
extensive ground-based AOT data comes from AERONET network [5]. Satellite Earth
remote sensing data are also used for studying aerosol pollution episodes over
the territory of Europe during eruption of volcanos [6]. Clarifications of links
between AOT and climate variability over the territory of Europe [7] as well as
contributions of anthropogenic and natural factors to the AOT level [8] are
carried out.
The goal of the research carried
out in this paper is to derive the typical picture of air pollution by aerosols
over the whole territory of Europe instead of climatological mean or study of
individual pollution episodes. The approach proposed below allows to considerably
reduce the influence on the resulting risk map of aerosol concentration values
not typical for the air over the territory under investigation.
Satellite Earth remote sensing data. Daily AOT values in
air column were taken from MODIS radiometer of Terra satellite product
available on regular latitude-longitude grid (1.0°×1.0°, about 110 km × 72 km for the 48º latitude)
during 01.03.2000 – 05.10.2012. AOT
values are unitless and are between -0.05..5 [2]. For each 1.0°×1.0° cell the maximal AOT value was
taken among pixels of scenes of level 2 with spatial resolution of 10 km
× 10 km that fall into that cell. The maximal values were chosen due to the
interest mainly to the pollution of anthropogenic character as well as
assumption that maximal AOT values may be observed primarily over cities and
areas of impact of industrial enterprises.
For the first time AOT
time series were obtained for each grid cell [1]. Time series are directly
available from within R analysis environment [9].
Risk calculation method. In this paper, the air
pollution risk is defined as the probability of observing a pollutant
concentration in a given interval over the territory under investigation. The risk is calculated for each grid cell.
For each grid cell the
number of days, S(i), was calculated with AOT
concentrations in intervals [0.2 × i]..[0.2
× i + 0.2], were i=0..24 as well as the number of days T for which AOT measurements are not
missing due to clouds or other reasons (AOT between -0.05..5).
The risk of pollution
for a grid cell is equal to R(i)=S(i) / T.
After experimental study
of the typical concentration of AOT over Europe, it was found that step 0.2 allows
capturing the majority of features of AOT pollution distribution over Europe. Risk
categories were also experimentally selected in order to keep acceptable the
number of categories (table 1).
Table 1. – Risk categories of air pollution by aerosols
over the territory of Europe
|
Interval |
Risk category |
|
0.0..0.2 |
Very low |
|
0.2..0.4 |
Low |
|
0.4..0.6 |
Moderate |
|
0.6..0.8 |
High |
|
0.8..1.0 |
Very high |
|
1.0..5.0 |
Catastrophic |
Results and discussion. Six risks maps have
the layout according to the presented earlier categories left to right and top
to bottom (fig. 1). Thus, the topmost left map corresponds to the very low risk
category (0.0..0.2) while the downmost right map corresponds to the catastrophic
risk category (1.0..5.0).
The created maps span
the territory of Europe approximately from London (England) on the west to Baku
(Azerbaijan) on the east and from Stockholm (Norway) on the north to Tyrant (Greece)
on the south. To better perceive the geographical context of the research, the
political map of Europe spanning approximately the area under investigation is
given on fig. 2.
The region on the north
of Italy between 44–46 latitude and 7–13 longitude is cut from all maps except
the first two (very low and low risk levels). Big cities located in that region
include Turin, Milan, Genoa, Parma, Bologna and Padua. The region was cut due to
its extremely high risk values what leads to low detail level of the color bar for
the rest part of Europe.
Very low AOT risk
levels are typical for Sweden and Norway. On the remaining maps, risks of aerosol
pollution for these countries are one of the lowest witnessing about relatively
clean (from aerosols) air over these countries. Low risk levels can be also
attributed to the atmosphere over the south of France. Grid cells with cities Kiev
(Ukraine) and Moscow (Russian Federation) are also noticeable as well as the
north of Italy witnessing about low level aerosol content being non-typical in
the atmosphere over that grid cells.
Low AOT risk levels
reach the highest values both over sea and land. High risk levels are observed
in the atmosphere over all seas (Black, Azov, the North Sea, the Balearic,
Tyrrhenian, Adriatic). Over land the highest risk levels are observed over the
center of the Western Europe (Poland, Germany, Czech Republic, Austria).
Although risk levels over seas and land are relatively the same, the observed
values over the former may be caused by natural while over the latter by
anthropogenic factors. This may take place since the same land area with high
risk levels for the low risk category is susceptible also to high risk levels
of more severe risk categories as can be seen from the corresponding maps.
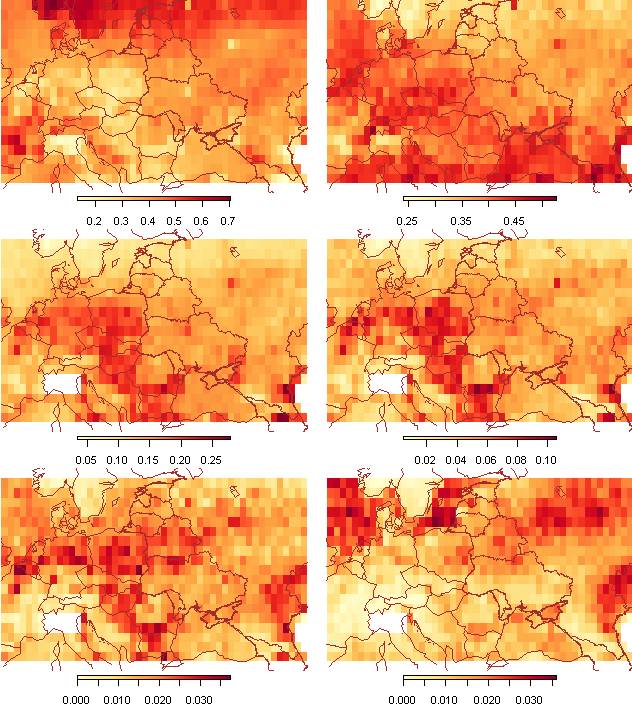
Figure 1. – Maps of air pollution risks by aerosols over the territory of
Europe
The distinguishable
area in the Western Europe has the highest risk levels for moderate, high and
very high risk categories. It is shaped as a stripe with northern end consisting
of Poland and Germany. It stretches to the south-east through the territories
of Slovakia, Hungary, Serbia, Bulgaria and the south of Romania.
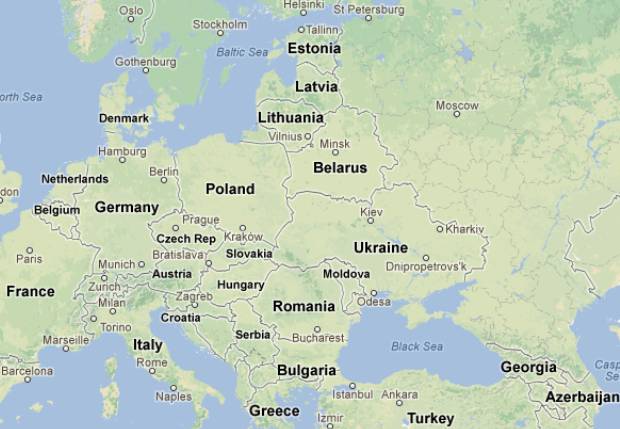
Figure 2. – The political map of Europe
corresponding to the area for which air pollution risks
by aerosols are shown on figure 1
Probably, the maps of
moderate, high and very high risk categories are the most representative for
identification of industrial regions. These regions include the north of Italy
and the characteristic stripe as was noted earlier. Kiev and Moscow cities are still
noticeable, however other cities, for example, Paris, Warsaw and Prague have
higher risk levels.
Catastrophic AOT risk
levels are noticeable over Russian Federation and North and Baltic seas. In the
latter case, the territory can be divided on European and Southern (the
Republic of Kalmykia, Astrakhan, Atyrau, West Kazakhstan regions) parts of
Russian Federation. Probably these risk levels for Russian Federation may be caused
primarily by natural disasters, for example, wildfires.
Conclusions and further work. In Europe, the most polluted air by aerosols is over the north of Italy. The air pollution risks by aerosols
of high category for that region are 1.6 times higher the risks for the rest of
Europe. Big cities located in that region include Turin, Milan, Genoa, Parma,
Bologna and Padua.
After the north of
Italy, the highest air pollution risks by aerosols in Europe are shaped as a stripe
with northern end consisting of Poland and Germany. It stretches to the south-east
through the territories of Slovakia, Hungary, Serbia, Bulgaria and the south of
Romania. The lowest air pollution risks by aerosols are for Sweden, Norway and
southern France.
Further work may be
directed to the rating of the European countries according to their risk levels
of air pollution by aerosols. The rate of a country can be calculated by
aggregating risk levels of grid cells that fall into the administrative
boundary of a country. Data with higher spatial resolution may be used, for
example, Aura satellite (OMI radiometer). This will allow to carry out a more
detail analysis of air pollution inside a separate country. Using data from a climate
reanalysis will allow to determine the dependence of aerosol concentration in a
grid cell from wind speed and direction. In some cases industrial enterprises
can be identified that have the greatest contribution to the aerosol pollution
of nearby territories.
Acknowledgements. This work was supported by Award No. UKM1-2973-DO-09 of the U.S. Civilian
Research & Development Foundation (CRDF).
Any opinions, findings and conclusions or recommendations expressed in
this material are those of the authors and do not necessarily reflect the views
of CRDF.
Paper availability. Electronic copy of this paper with
colored maps is also freely available at http://wikience.donntu.edu.ua/rodriges
Literature:
1. Rodriges Zalipynis, R.A.
Representing Earth remote sensing data as time series / R.A. Rodriges Zalipynis
// Donetsk National Technical University. Series: System analysis and
information technology in environmental and social sciences, №2, 2012.
2. MODIS Atmosphere [Electronic
resource] – Access method: http://modis-atmos.gsfc.nasa.gov/ (24.01.2013)
3. Koukouli, M.E. Signs of a
negative trend in the MODIS aerosol optical depth over the Southern Balkans /
M.E. Koukouli, S. Kazadzis, V. Amiridis, C. Ichoku, D.S. Balis, A.F. Bais //
Atmos. Environ., № 44, 2010, P. 1219–1228.
4. Yoon, J. Analysis of
linear long term trend of aerosol optical thickness derived from SeaWiFS using
BAER over Europe and South China / J. Yoon, W. von Hoyningen-Huene, M. Vountas,
J.P. Burrows // Atmos. Chem. Phys., № 11, 2011, P. 12149–12167.
5. Aerosol Robotic Network
(AERONET) Homepage [Electronic resource] – Access method:
http://aeronet.gsfc.nasa.gov/ (24.01.2013)
6. Ansmann, A. The 16 April
2010 major volcanic ash plume over central Europe: EARLINET lidar and AERONET
photometer observations at Leipzig and Munich, Germany / A. Ansmann, M. Tesche,
S. Gross, V. Freudenthaler, P. Seifert, A. Hiebsch, J. Schmidt, U. Wandinger,
I. Mattis, D. Müller, M. Wiegner // Geophys. Res. Lett., № 37, L13810,
2010.
7. Chiacchio, M. Decadal variability
of aerosol optical depth in Europe and its relationship to the temporal shift
of the North Atlantic Oscillation in the realm of dimming and brightening / M.
Chiacchio, T. Ewen, M. Wild, M. Chin, T. Diehl // J. Geophys. Res., № 116,
D02108, 2011.
8. Streets, D. G.
Anthropogenic and natural contributions to regional trends in aerosol optical
depth, 1980–2006 / D.G. Streets, F. Yan, M. Chin, T. Diehl, N. Mahowald, M.
Schultz, M. Wild, Y. Wu, C. Yu // J. Geophys. Res., № 114, D00d18, 2009.
9. R: A language and
environment for statistical computing [Electronic resource] – Access method:
http://www.R-project.org/ (24.01.2013)